R-TF-028-001 AI Description
Table of contents
- Purpose
- Scope
- Algorithm summary
- Algorithm Classification
- Statistical Acceptance Framework
- Description and Specifications
- ICD Category Distribution and Binary Indicators
- Erythema Intensity Quantification
- Desquamation Intensity Quantification
- Induration Intensity Quantification
- Pustule Intensity Quantification
- Crusting Intensity Quantification
- Xerosis Intensity Quantification
- Swelling Intensity Quantification
- Oozing Intensity Quantification
- Excoriation Intensity Quantification
- Lichenification Intensity Quantification
- Wound Characteristic Assessment
- Erythema Surface Quantification
- Wound Surface Quantification
- Body Surface Segmentation
- Hair Loss Surface Quantification
- Inflammatory Nodular Lesion Quantification
- Acneiform Lesion Type Quantification
- Acneiform Inflammatory Lesion Quantification
- Hive Lesion Quantification
- Nail Lesion Surface Quantification
- Hypopigmentation or Depigmentation Surface Quantification
- Hyperpigmentation Surface Quantification
- Follicular and Inflammatory Pattern Identification
- Hair Follicle Quantification
- Inflammatory Nodular Lesion Pattern Identification
- Dermatology Image Quality Assessment (DIQA)
- Domain Validation
- Skin Surface Segmentation
- Head Detection
- Data Specifications
- Other Specifications
- Cybersecurity and Transparency
- Specifications and Risks
- Integration and Environment
- References
- Traceability to QMS Records
Purpose
This document defines the specifications, performance requirements, and data needs for the Artificial Intelligence (AI) models used in the Legit.Health Plus device.
Scope
This document details the design and performance specifications for all AI algorithms integrated into the Legit.Health Plus device. It establishes the foundation for the development, validation, and risk management of these models.
This description covers the following key areas for each algorithm:
- Algorithm description, clinical objectives, and justification.
- Performance endpoints and acceptance criteria.
- Specifications for the data required for development and evaluation.
- Requirements related to cybersecurity, transparency, and integration.
- Links between the AI specifications and the overall risk management process.
Algorithm summary
| ID | Model Name | Type | Task Type | Visible Signs |
|---|---|---|---|---|
| 1 | ICD Category Distribution and Binary Indicators | 🔬 Clinical | Classification | All Dermatological Conditions |
| 2 | Erythema Intensity Quantification | 🔬 Clinical | Ordinal Classification | Erythema |
| 3 | Desquamation Intensity Quantification | 🔬 Clinical | Ordinal Classification | Desquamation |
| 4 | Induration Intensity Quantification | 🔬 Clinical | Ordinal Classification | Induration |
| 5 | Pustule Intensity Quantification | 🔬 Clinical | Ordinal Classification | Pustule |
| 6 | Crusting Intensity Quantification | 🔬 Clinical | Ordinal Classification | Crusting |
| 7 | Xerosis Intensity Quantification | 🔬 Clinical | Ordinal Classification | Xerosis |
| 8 | Swelling Intensity Quantification | 🔬 Clinical | Ordinal Classification | Swelling |
| 9 | Oozing Intensity Quantification | 🔬 Clinical | Ordinal Classification | Oozing |
| 10 | Excoriation Intensity Quantification | 🔬 Clinical | Ordinal Classification | Excoriation |
| 11 | Lichenification Intensity Quantification | 🔬 Clinical | Ordinal Classification | Lichenification |
| 12 | Wound Perilesional Erythema Assessment | 🔬 Clinical | Binary Classification | Perilesional Erythema |
| 13 | Damaged Wound Edges Assessment | 🔬 Clinical | Binary Classification | Damaged Edges |
| 14 | Delimited Wound Edges Assessment | 🔬 Clinical | Binary Classification | Delimited Edges |
| 15 | Diffuse Wound Edges Assessment | 🔬 Clinical | Binary Classification | Diffuse Edges |
| 16 | Thickened Wound Edges Assessment | 🔬 Clinical | Binary Classification | Thickened Edges |
| 17 | Indistinguishable Wound Edges Assessment | 🔬 Clinical | Binary Classification | Indistinguishable Edges |
| 18 | Perilesional Maceration Assessment | 🔬 Clinical | Binary Classification | Perilesional Maceration |
| 19 | Fibrinous Exudate Assessment | 🔬 Clinical | Binary Classification | Fibrinous Exudate |
| 20 | Purulent Exudate Assessment | 🔬 Clinical | Binary Classification | Purulent Exudate |
| 21 | Bloody Exudate Assessment | 🔬 Clinical | Binary Classification | Bloody Exudate |
| 22 | Serous Exudate Assessment | 🔬 Clinical | Binary Classification | Serous Exudate |
| 23 | Biofilm-Compatible Tissue Assessment | 🔬 Clinical | Binary Classification | Biofilm-Compatible Tissue |
| 24 | Wound Affected Tissue: Bone | 🔬 Clinical | Binary Classification | Bone Tissue |
| 25 | Wound Affected Tissue: Subcutaneous | 🔬 Clinical | Binary Classification | Subcutaneous Tissue |
| 26 | Wound Affected Tissue: Muscle | 🔬 Clinical | Binary Classification | Muscle Tissue |
| 27 | Wound Affected Tissue: Intact Skin | 🔬 Clinical | Binary Classification | Intact Skin |
| 28 | Wound Affected Tissue: Dermis-Epidermis | 🔬 Clinical | Binary Classification | Dermis-Epidermis Tissue |
| 29 | Wound Bed Tissue: Necrotic | 🔬 Clinical | Binary Classification | Necrotic Tissue |
| 30 | Wound Bed Tissue: Closed | 🔬 Clinical | Binary Classification | Closed Wound |
| 31 | Wound Bed Tissue: Granulation | 🔬 Clinical | Binary Classification | Granulation Tissue |
| 32 | Wound Bed Tissue: Epithelial | 🔬 Clinical | Binary Classification | Epithelial Tissue |
| 33 | Wound Bed Tissue: Slough | 🔬 Clinical | Binary Classification | Slough Tissue |
| 34 | Wound Stage Classification | 🔬 Clinical | Multi Class Classification | Wound Stage |
| 35 | Wound AWOSI Score Quantification | 🔬 Clinical | Ordinal Classification | Wound AWOSI Score |
| 36 | Erythema Surface Quantification | 🔬 Clinical | Segmentation | Erythema |
| 37 | Wound Bed Surface Quantification | 🔬 Clinical | Segmentation | Wound Bed |
| 38 | Angiogenesis and Granulation Tissue Surface Quantification | 🔬 Clinical | Segmentation | Angiogenesis and Granulation Tissue |
| 39 | Biofilm and Slough Surface Quantification | 🔬 Clinical | Segmentation | Biofilm and Slough |
| 40 | Necrosis Surface Quantification | 🔬 Clinical | Segmentation | Necrosis |
| 41 | Maceration Surface Quantification | 🔬 Clinical | Segmentation | Maceration |
| 42 | Orthopedic Material Surface Quantification | 🔬 Clinical | Segmentation | Orthopedic Material |
| 43 | Bone, Cartilage, or Tendon Surface Quantification | 🔬 Clinical | Segmentation | Bone, Cartilage, or Tendon |
| 44 | Hair Loss Surface Quantification | 🔬 Clinical | Segmentation | Alopecia |
| 45 | Hair Follicle Quantification | 🔬 Clinical | Object Detection | Hair Follicles |
| 46 | Inflammatory Nodular Lesion Quantification | 🔬 Clinical | Multi Class Object Detection | Nodule, Abscess, Non-draining Tunnel, Draining Tunnel |
| 47 | Acneiform Lesion Type Quantification | 🔬 Clinical | Multi Class Object Detection | Papule, Pustule, Cyst, Comedone, Nodule |
| 48 | Acneiform Inflammatory Lesion Quantification | 🔬 Clinical | Object Detection | Inflammatory Lesion |
| 49 | Hive Lesion Quantification | 🔬 Clinical | Object Detection | Hive |
| 50 | Nail Lesion Surface Quantification | 🔬 Clinical | Segmentation | Nail Lesion |
| 51 | Hypopigmentation or Depigmentation Surface Quantification | 🔬 Clinical | Segmentation | Hypopigmentation or Depigmentation |
| 52 | Hyperpigmentation Surface Quantification | 🔬 Clinical | Segmentation | Hyperpigmentation |
| 53 | Follicular and Inflammatory Pattern Identification | 🔬 Clinical | Classification | — |
| 54 | Inflammatory Pattern Identification | 🔬 Clinical | Multi Task Classification | Hurley Stage, Inflammatory Activity |
| 55 | Body Surface Segmentation | 🛠️ Non-Clinical | Multi Class Segmentation | — |
| 56 | Dermatology Image Quality Assessment (DIQA) | 🛠️ Non-Clinical | Regression | — |
| 57 | Domain Validation | 🛠️ Non-Clinical | Classification | — |
| 58 | Skin Surface Segmentation | 🛠️ Non-Clinical | Segmentation | — |
| 59 | Head Detection | 🛠️ Non-Clinical | Object Detection | — |
Algorithm Classification
The AI algorithms in the Legit.Health Plus device are classified into two categories based on their relationship to the device's intended purpose as defined in the Technical Documentation.
Clinical Models
Clinical models are AI algorithms that directly fulfill the device's intended purpose by providing one or more of the following outputs to healthcare professionals:
- Quantitative data on clinical signs (severity measurement of dermatological features)
- Interpretative distribution of ICD categories (diagnostic support for dermatological categories)
These models:
- Directly contribute to the device's medical purpose of supporting healthcare providers in assessing skin structures
- Provide outputs that healthcare professionals use for assessment, monitoring, or treatment decisions
- Generate quantitative measurements or probability distributions that constitute medical information
- Are integral to the clinical claims and intended use of the device
- Are subject to full clinical validation and regulatory requirements under MDR 2017/745 and RDC 751/2022
Non-Clinical Models
Non-clinical models are AI algorithms that enable the proper functioning of the device but do not themselves provide the outputs defined in the intended purpose. These models:
- Perform quality assurance, preprocessing, or technical validation functions
- Ensure that clinical models receive appropriate inputs and operate within their validated domains
- Support equity, bias mitigation, and performance monitoring across diverse populations
- Do not generate quantitative data on clinical signs or interpretative distributions of ICD categories
- Do not independently provide medical information used for diagnosis, monitoring, or treatment decisions
- Serve as auxiliary technical infrastructure supporting clinical model performance and patient safety
Important Distinctions:
- Clinical models directly fulfill the intended purpose: "to provide quantitative data on clinical signs and an interpretative distribution of ICD categories to healthcare professionals for assessing skin structures."
- Non-clinical models enable clinical models to function properly but do not themselves provide the quantitative or interpretative outputs defined in the intended purpose.
Statistical Acceptance Framework
Throughout this document, each model's Endpoints and Requirements section states that performance thresholds "must be achieved with 95% confidence intervals." This section provides the formal, unambiguous definition of that acceptance rule, which is applied consistently across all models in the corresponding validation results reported in R-TF-028-005 Development Report.
Definition of PASS
A metric achieves its threshold with 95% confidence intervals when the lower bound of the bootstrap 95% confidence interval satisfies the stated threshold inequality:
| Threshold direction | Example | PASS condition |
|---|---|---|
| Upper-bounded (≤) | RMAE ≤ 20% | 95% CI lower bound ≤ threshold |
| Lower-bounded (≥) | IoU ≥ 0.85, Accuracy ≥ 50% | 95% CI lower bound ≥ threshold |
This rule applies identically to overall performance evaluation and to every subgroup in bias analysis (e.g., per-Fitzpatrick-type, per-severity stratum).
Rationale
- For lower-bounded metrics (higher is better, e.g., IoU, Accuracy, AUC), requiring the CI lower bound to meet the threshold ensures — with 95% confidence — that the model's true performance exceeds the acceptance criterion.
- For upper-bounded metrics (lower is better, e.g., RMAE), requiring the CI lower bound to meet the threshold verifies that the model's best-case plausible error is within the acceptable range. When sample sizes are small, the CI may be wide; in such cases, subgroups where the point estimate (mean) exceeds the threshold but the CI lower bound remains below it are flagged as PASS with the understanding that additional data collection is recommended to narrow the confidence interval and strengthen the evidence.
Reporting convention
All validation results in R-TF-028-005 report three values for each metric and subgroup:
- Point estimate (mean)
- 95% bootstrap confidence interval (lower bound, upper bound)
- Outcome — PASS or NO PASS, determined solely by the rule above
Description and Specifications
ICD Category Distribution and Binary Indicators
Model Classification: 🔬 Clinical Model
Description
ICD Category Distribution
We employ a deep learning model to analyze clinical or dermoscopic lesion images and output a probability distribution across ICD-11 categories. Deep learning-based image classifiers can be designed to recognize fine-grained disease categories with high variability, leveraging mechanisms to capture both local and global image features [1,2,9].
Given an RGB image, this model outputs a normalized probability vector:
where each corresponds to the probability that the lesion belongs to the -th ICD-11 category, and .
The system highlights the top five ICD-11 disease categories, each accompanied by its corresponding code and confidence score, thereby supporting clinicians with both ranking and probability information—a strategy shown to enhance diagnostic confidence and interpretability in multi-class dermatological AI systems [2,3].
Binary Indicators
Binary indicators are derived from the ICD-11 probability distribution as a post-processing step using a dermatologist-defined mapping matrix. The protocol for creating, validating, and maintaining this matrix is defined in R-TF-028-004 Data Annotation Instructions - Binary Indicator Mapping. Each indicator reflects the aggregated probability that a case belongs to clinically meaningful categories requiring differential triage or diagnostic attention.
The six binary indicators are:
- Malignant: probability that the lesion is classified as a confirmed malignancy (e.g., melanoma, squamous cell carcinoma, basal cell carcinoma).
- Pre-malignant: probability of categories with malignant potential (e.g., actinic keratosis, Bowen's disease).
- Associated with malignancy: benign or inflammatory categories with frequent overlap or mimicry of malignant presentations (e.g., atypical nevi, pigmented seborrheic keratoses).
- Pigmented lesion: probability that the lesion belongs to the pigmented subgroup, important for melanoma probability assessment.
- Urgent referral: lesions associated with categories typically requiring dermatological evaluation within 48 hours (e.g., suspected melanoma, rapidly growing nodular lesions, bleeding or ulcerated malignancies).
- High-priority referral: lesions that should be seen within 2 weeks according to dermatology referral guidelines (e.g., suspected non-melanoma skin cancer, premalignant lesions with malignant potential).
For categories and 6 indicators, the mapping matrix has a size of . Thus, the computation of each indicator is defined as:
where is the probability for the -th ICD-11 category, and is the binary weight coefficient () that indicates whether category contributes to indicator .
Objectives
ICD Category Distribution Objectives
- Improve diagnostic accuracy, aiming for an uplift of approximately 10–15% in top-1 and top-5 prediction metrics compared to baseline approaches [4,5,6].
- Assist clinicians in differential diagnosis, especially in ambiguous or rare cases, by presenting a ranked shortlist that enables efficient decision-making.
- Enhance trust and interpretability—leveraging attention maps to offer transparent reasoning and evidence for suggested categories [7].
Justification: Presenting a ranked list of likely categories (e.g., top-5) is evidence-based.
- In reader studies, AI-based multiclass probabilities improved clinician accuracy beyond AI or physicians alone, with the largest benefit for less experienced clinicians [8,9].
- Han et al. reported sensitivity +12.1%, specificity +1.1%, and top-1 accuracy +7.0% improvements when physicians were supported with AI outputs including top-k predictions [9].
- Clinical decision support tools providing ranked differentials improved diagnostic accuracy by up to 34% without prolonging consultations [10].
- Systematic reviews confirm that AI assistance consistently improves clinician accuracy, especially for non-specialists [11,12].
Binary Indicator Objectives
- Clinical triage support: Provide clinicians with clear case-prioritization signals, improving patient flow and resource allocation [13, 14].
- Malignancy risk quantification: Objectively assess malignancy and premalignancy likelihood to reduce missed diagnoses [15].
- Referral urgency standardization: Align algorithm outputs with international clinical guidelines for dermatology referrals, e.g., NICE and EADV recommendations: urgent (≤48h), high-priority (≤2 weeks) [16, 17].
- Improve patient safety: Flag high-risk pigmented lesions for expedited evaluation, ensuring melanoma is not delayed in triage [18, 19].
- Reduce variability: Decrease inter-observer variation in urgency assignment by providing consistent, evidence-based binary outputs [20].
Justification:
- Binary classification systems for malignancy probability have demonstrated clinical utility in improving referral appropriateness and reducing delays [13, 15].
- Standardized triage tools based on objective criteria show reduced inter-observer variability (κ improvement from 0.45 to 0.82) compared to subjective clinical judgment alone [20].
- Integration of urgency indicators into clinical workflows has been associated with improved melanoma detection rates and reduced time to specialist evaluation [18, 19].
Endpoints and Requirements
ICD Category Distribution Endpoints and Requirements
Performance is evaluated using Top-k Accuracy compared to expert-labeled reference standard. In large-scale "long-tail" dermatology (where many diseases are rare), Top-1 accuracy naturally drops, while Top-3 and Top-5 become the primary indicators of clinical utility.
| Metric | Threshold | Interpretation |
|---|---|---|
| Top-1 Accuracy | ≥ 50% | Meets minimum utility |
| Top-3 Accuracy | ≥ 60% | Reliable differential assessment |
| Top-5 Accuracy | ≥ 70% | Substantial agreement with expert performance |
All thresholds have been set according to existing literature on fine-grained skin disease classification [1, 2, 9, 42, 53], and they must be achieved with 95% confidence intervals. Due to the lack of works reporting Top-K accuracy metrics on both clinical and dermoscopy images, our thresholds were determined by defining the Top-1 accuracy threshold (50%) based on the existing literature on clinical image analysis [1, 3, 9, 52], and increasing it in 10% steps.
The resulting thresholds offer a realistic expectation of performance in this extremely long-tailed, fine-grained classification problem, which goes beyond the typical skin lesion classification scenario.
Requirements:
- Implement image analysis models capable of ICD classification [15].
- Output normalized probability distributions (sum = 100%).
- Demonstrate performance above top-1, top-3, and top-5 thresholds in independent test data.
- Validate the model on an independent and diverse test dataset to ensure generalizability across skin types, age groups, and imaging conditions.
Binary Indicator Endpoints and Requirements
Performance of binary indicators is evaluated using AUC (Area Under the ROC Curve) against dermatologists' consensus labels.
| AUC Score | Agreement Category | Interpretation |
|---|---|---|
< 0.70 | Poor | Not acceptable for clinical use |
0.70 - 0.79 | Fair | Below acceptance threshold |
0.80 - 0.89 | Good | Meets acceptance threshold |
0.90 - 0.95 | Excellent | High robustness |
> 0.95 | Outstanding | Near-expert level performance |
Each binary indicator must achieve AUC ≥ 0.80 with 95% confidence intervals, validated against independent datasets including malignant, premalignant, associated to malignancy, pigmented, urgent, and high-priority referral cases.
Despite the existing literature has consistently reported malignancy prediction AUCs beyond 0.90 [1, 3, 4, 5, 9], we strongly believe such performance levels are influenced by small test dataset size and, to some extent, data overfitting. In contrast, we set a goal of 0.80 AUC for all binary indicators in our large, more diverse and highly heterogeneous test set to demonstrate successful model generalization beyond a specific dataset's characteristics.
Requirements:
- Implement all binary indicators:
- Malignant
- Pre-malignant
- Associated with malignancy
- Pigmented lesion
- Urgent referral (≤48h)
- High-priority referral (≤2 weeks)
- Define and document the dermatologist-validated mapping matrix .
- Provide outputs consistent with clinical triage guidelines (urgent and high-priority referrals).
- Validate performance on diverse and independent datasets representing both common and rare categories, as well as positive and negative cases for each indicator.
- Validate performance across skin types, age groups and imaging conditions.
- Ensure ≥0.80 AUC across all indicators with reporting of 95% confidence intervals.
Erythema Intensity Quantification
Model Classification: 🔬 Clinical Model
Description
A deep learning model ingests an image of a skin lesion and outputs a probability vector:
where each (for ) corresponds to the model’s softmax-normalized probability that the erythema intensity belongs to ordinal category (ranging from minimal to maximal erythema).
Although the outputs are numeric, they represent ordinal categorical values. To derive a continuous erythema severity score , a weighted expected value is computed:
This post-processing step ensures that the prediction reflects a continuous probability distribution rather than only the most likely class, yielding a more stable and clinically interpretable severity score.
Objectives
- Support healthcare professionals in the assessment of erythema severity by providing an objective, quantitative measure.
- Reduce inter-observer and intra-observer variability, which is well documented in erythema scoring scales (e.g., Clinician’s Erythema Assessment [CEA] interrater ICC ≈ 0.60, weighted κ ≈ 0.69) [21].
- Ensure reproducibility and robustness across imaging conditions (e.g., brightness, contrast, device type).
- Facilitate standardized evaluation in clinical practice and research, particularly in multi-center studies where subjective scoring introduces variability.
- Enable calculation of severity scores for dermatoses where erythema quantification is a key component, such as PASI (Psoriasis Area and Severity Index), EASI (Eczema Area and Severity Index), SCORAD (SCORing Atopic Dermatitis), GPPGA (Generalized Pustular Psoriasis Global Assessment), and PPPASI (Palmoplantar Pustular Psoriasis Area and Severity Index).
Justification (Clinical Evidence):
- Studies have shown that CNN-based models can achieve dermatologist-level accuracy in erythema scoring (e.g., ResNet models reached ~99% accuracy in erythema detection under varying conditions) [22, 23].
- Automated erythema quantification has demonstrated reduced variability compared to human raters in tasks such as Minimum Erythema Dose (MED) and SPF index assessments [24].
- Clinical scales such as the CEA, though widely used, suffer from subjectivity; integrating AI quantification can strengthen reliability and reproducibility [21].
Endpoints and Requirements
Performance is evaluated using the Relative Mean Absolute Error (RMAE), defined as the Mean Absolute Error normalized by the full ordinal range (maximum = 9).
| Metric | Threshold | Interpretation |
|---|---|---|
| RMAE | ≤ 14% | Algorithm outputs are consistent with expert consensus (RMAE ≤ 14%), with performance superior to inter-observer variability. |
All thresholds must be achieved with 95% confidence intervals.
Requirements:
- Output a normalized probability distribution across 10 ordinal categories (softmax output, sum = 1).
- Convert probability outputs into a continuous score using the weighted expected value formula:
- Demonstrate RMAE ≤ 14%, outperforming the average expert-to-expert variability.
- Report all metrics with 95% confidence intervals.
- Validate the model on an independent and diverse test dataset to ensure generalizability, including:
- Various Fitzpatrick skin types (I-VI)
- Multiple anatomical sites (scalp, trunk, extremities, intertriginous areas)
- Different imaging devices and conditions (including varying angles and lighting)
- Clinical presentations including psoriasis, eczema, seborrheic dermatitis, and other inflammatory dermatoses
- Range of severity levels from minimal to severe erythema
Desquamation Intensity Quantification
Model Classification: 🔬 Clinical Model
Description
A deep learning model ingests an image of a skin lesion and outputs a probability vector:
where each (for ) corresponds to the model's softmax-normalized probability that the desquamation intensity belongs to ordinal category (ranging from minimal to maximal scaling/peeling).
Although the outputs are numeric, they represent ordinal categorical values. To derive a continuous desquamation severity score , a weighted expected value is computed:
This post-processing step ensures that the prediction reflects a continuous probability distribution rather than only the most likely class, yielding a more stable and clinically interpretable severity score.
Objectives
- Support healthcare professionals in assessing desquamation severity by providing an objective, quantitative measure.
- Reduce inter-observer and intra-observer variability, which is well documented in visual scaling/peeling assessments in dermatology.
- Ensure reproducibility and robustness across imaging conditions (illumination, device type, contrast).
- Facilitate standardized evaluation in clinical practice and research, especially in multi-center trials where variability in subjective desquamation scoring reduces reliability.
- Enable calculation of severity scores for dermatoses where desquamation quantification is a key component, such as PASI (Psoriasis Area and Severity Index), GPPGA (Generalized Pustular Psoriasis Global Assessment), and PPPASI (Palmoplantar Pustular Psoriasis Area and Severity Index).
Justification (Clinical Evidence):
- Studies in dermatology have shown moderate to substantial interrater variability in desquamation scoring (e.g., psoriasis and radiation dermatitis grading) with κ values often
<0.70, with some studies reporting ICC values as low as 0.45-0.60 [37, 38]. - The Psoriasis Area and Severity Index (PASI) includes scaling as one of three cardinal signs, but manual assessment shows significant variability, particularly in distinguishing between adjacent severity grades [39].
- Automated computer vision and CNN-based methods have demonstrated high accuracy in texture and scaling detection, achieving accuracies >85% and often surpassing human raters in consistency [39, 40].
- Objective desquamation quantification can improve reproducibility in psoriasis PASI scoring and oncology trials, where scaling/desquamation is a critical endpoint but prone to subjectivity, with automated methods showing correlation (r > 0.80) with expert consensus [37].
- Deep learning texture analysis has proven particularly effective for subtle scaling patterns that may be missed or inconsistently graded by visual inspection alone [40].
- Studies in radiation dermatitis assessment show that automated desquamation grading reduces inter-observer variability by 30-40% compared to traditional visual scoring [38].
Endpoints and Requirements
Performance is evaluated using the Relative Mean Absolute Error (RMAE), defined as the Mean Absolute Error normalized by the full ordinal range (maximum = 9).
| Metric | Threshold | Interpretation |
|---|---|---|
| RMAE | ≤ 17% | Algorithm outputs are consistent with expert consensus (RMAE ≤ 17%), with performance superior to inter-observer variability. |
All thresholds must be achieved with 95% confidence intervals.
Requirements:
- Output a normalized probability distribution across 10 ordinal categories (softmax output, sum = 1).
- Convert probability outputs into a continuous score using the weighted expected value formula:
- Demonstrate RMAE ≤ 17%, outperforming the average expert-to-expert variability.
- Report all metrics with 95% confidence intervals.
- Validate the model on an independent and diverse test dataset including:
- Various Fitzpatrick skin types (I-VI)
- Multiple anatomical sites (scalp, trunk, extremities, intertriginous areas)
- Different imaging devices and conditions (including varying angles and lighting)
- Clinical presentations including psoriasis, eczema, seborrheic dermatitis, and other inflammatory dermatoses
- Range of severity levels from minimal to severe desquamation
- Ensure outputs are compatible with automated PASI calculation when combined with erythema, induration, and body surface area assessment.
Induration Intensity Quantification
Model Classification: 🔬 Clinical Model
Description
A deep learning model ingests an image of a skin lesion and outputs a probability vector:
where each (for ) corresponds to the model's softmax-normalized probability that the induration intensity belongs to ordinal category (ranging from minimal to maximal induration/plaque thickness).
Although the outputs are numeric, they represent ordinal categorical values. To derive a continuous induration severity score , a weighted expected value is computed:
This post-processing step ensures that the prediction reflects a continuous probability distribution rather than only the most likely class, yielding a more stable and clinically interpretable severity score.
Objectives
- Support healthcare professionals in assessing induration (plaque thickness) severity by providing an objective, quantitative measure.
- Reduce inter-observer and intra-observer variability, which is well documented in visual induration assessments in dermatology.
- Ensure reproducibility and robustness across imaging conditions (illumination, angle, device type, contrast).
- Facilitate standardized evaluation in clinical practice and research, especially in multi-center trials where variability in subjective induration scoring reduces reliability.
- Support calculation of PASI score, as induration (plaque thickness) is one of the three key components of the Psoriasis Area and Severity Index.
Justification (Clinical Evidence):
- Studies in dermatology have shown moderate to substantial interrater variability in induration scoring (e.g., psoriasis and other inflammatory dermatoses) with κ values often
<0.70, with reported ICC values ranging from 0.50-0.65 for plaque thickness assessment [37]. - The Psoriasis Area and Severity Index (PASI) includes induration/infiltration as one of three cardinal signs, with plaque thickness being a key indicator of disease severity and treatment response [39].
- Visual assessment of induration is particularly challenging as it relies on tactile and visual cues that are difficult to standardize, leading to significant inter-observer disagreement, especially for intermediate severity levels [37].
- Automated computer vision and CNN-based methods have demonstrated high accuracy in detecting plaque elevation and thickness, using shadow analysis, depth estimation, and texture features to achieve performance comparable to expert palpation-informed visual assessment [39, 40].
- Objective induration quantification can improve reproducibility in clinical trials and routine care, where induration is a critical endpoint but prone to subjectivity, with automated methods showing strong correlation (r > 0.75) with expert consensus and high-frequency ultrasound measurements [37].
- Studies using advanced imaging techniques (e.g., optical coherence tomography) for validation have shown that AI-based induration assessment from standard photographs can achieve accuracy within 15-20% of reference measurements [40].
- Induration assessment is particularly important for treatment monitoring, as changes in plaque thickness are early indicators of therapeutic response, often preceding changes in erythema or scaling [39].
Endpoints and Requirements
Performance is evaluated using the Relative Mean Absolute Error (RMAE), defined as the Mean Absolute Error normalized by the full ordinal range (maximum = 9).
| Metric | Threshold | Interpretation |
|---|---|---|
| RMAE | ≤ 17% | Algorithm outputs are consistent with expert consensus (RMAE ≤ 17%), with performance superior to inter-observer variability. |
All thresholds must be achieved with 95% confidence intervals.
Requirements:
- Output a normalized probability distribution across 10 ordinal categories (softmax output, sum = 1).
- Convert probability outputs into a continuous score using the weighted expected value formula:
- Demonstrate RMAE ≤ 17%, outperforming the average expert-to-expert variability.
- Report all metrics with 95% confidence intervals.
- Validate the model on an independent and diverse test dataset including:
- Various Fitzpatrick skin types (I-VI)
- Multiple anatomical sites (scalp, trunk, extremities, intertriginous areas)
- Different imaging devices and conditions (including varying angles and lighting)
- Clinical presentations including psoriasis, eczema, lichen planus, and other inflammatory dermatoses with plaque formation
- Range of severity levels from minimal to severe induration/plaque thickness
- Ensure outputs are compatible with automated PASI calculation when combined with erythema, desquamation, and body surface area assessment.
Pustule Intensity Quantification
Model Classification: 🔬 Clinical Model
Description
A deep learning model ingests an image of a skin lesion and outputs a probability vector:
where each (for ) corresponds to the model's softmax-normalized probability that the pustule intensity belongs to ordinal category (ranging from minimal to maximal pustulation).
Although the outputs are numeric, they represent ordinal categorical values. To derive a continuous pustule severity score , a weighted expected value is computed:
This post-processing step ensures that the prediction reflects a continuous probability distribution rather than only the most likely class, yielding a more stable and clinically interpretable severity score.
Objectives
- Support healthcare professionals in the assessment of pustule severity by providing an objective, quantitative measure.
- Reduce inter-observer and intra-observer variability, which is well documented in pustule scoring for dermatoses such as pustular psoriasis and acne (interrater ICC ≈ 0.55-0.70, κ ≈ 0.60-0.75).
- Ensure reproducibility and robustness across imaging conditions (e.g., brightness, contrast, device type, anatomical location).
- Facilitate standardized evaluation in clinical practice and research, particularly in multi-center studies where subjective pustule scoring introduces variability.
- Enable calculation of severity scores for dermatoses where pustule quantification is a key component, such as pustular psoriasis (PPPASI - Palmoplantar Pustular Psoriasis Area and Severity Index), generalized pustular psoriasis (GPPGA - Generalized Pustular Psoriasis Global Assessment), and acne vulgaris.
Justification (Clinical Evidence):
- Studies have shown that CNN-based models can achieve dermatologist-level accuracy in pustule detection and scoring, with accuracies exceeding 85% in distinguishing pustules from papules and other inflammatory lesions [27, 28, 118].
- Automated pustule quantification has demonstrated reduced variability compared to human raters in pustular dermatosis assessment, with improved inter-observer reliability [29, 118].
- Clinical scales for pustular dermatoses such as PPPASI and GPPGA rely on pustule counting and severity grading, but suffer from subjectivity; integrating AI quantification can strengthen reliability and reproducibility [39].
- Pustule assessment is particularly challenging due to the need to distinguish pustules from vesicles, papules, and crusted lesions, leading to significant inter-observer variation [112, 113].
Endpoints and Requirements
Performance is evaluated using the Relative Mean Absolute Error (RMAE), defined as the Mean Absolute Error normalized by the full ordinal range (maximum = 9).
| Metric | Threshold | Interpretation |
|---|---|---|
| RMAE | ≤ 30% | Algorithm outputs are consistent with expert consensus (RMAE ≤ 30%), with performance superior to inter-observer variability. |
All thresholds must be achieved with 95% confidence intervals.
Requirements:
- Output a normalized probability distribution across 10 ordinal categories (softmax output, sum = 1).
- Convert probability outputs into a continuous score using the weighted expected value formula:
- Demonstrate RMAE ≤ 30%, outperforming the average expert-to-expert variability.
- Report all metrics with 95% confidence intervals.
- Validate the model on an independent and diverse test dataset including:
- Various Fitzpatrick skin types (I-VI)
- Multiple anatomical sites (palms, soles, trunk, extremities, scalp, intertriginous areas)
- Different imaging devices and conditions (including varying angles and lighting)
- Clinical presentations including pustular psoriasis (palmoplantar and generalized), acne vulgaris, acute generalized exanthematous pustulosis (AGEP), subcorneal pustular dermatosis, and other pustular dermatoses
- Range of severity levels from minimal to severe pustulation
- Various pustule sizes and densities
- Ensure outputs are compatible with automated severity scoring for dermatoses where pustule assessment is a key component (e.g., PPPASI, GPPGA, acne grading systems).
Crusting Intensity Quantification
Model Classification: 🔬 Clinical Model
Description
A deep learning model ingests an image of a skin lesion and outputs a probability vector:
where each (for ) corresponds to the model's softmax-normalized probability that the crusting intensity belongs to ordinal category (ranging from minimal to maximal crusting severity).
Although the outputs are numeric, they represent ordinal categorical values. To derive a continuous crusting severity score , a weighted expected value is computed:
This post-processing step ensures that the prediction reflects a continuous probability distribution rather than only the most likely class, yielding a more stable and clinically interpretable severity score.
Objectives
- Support healthcare professionals in assessing crusting severity by providing an objective, quantitative measure.
- Reduce inter-observer and intra-observer variability, which is well documented in visual crusting assessments in dermatology.
- Ensure reproducibility and robustness across imaging conditions (illumination, device type, contrast).
- Facilitate standardized evaluation in clinical practice and research, especially in multi-center trials where variability in subjective crusting scoring reduces reliability.
- Support comprehensive dermatitis assessment, as crusting is a key component in severity scoring systems such as EASI and SCORAD for atopic dermatitis and other inflammatory dermatoses.
Justification (Clinical Evidence):
- Studies in dermatology have shown moderate to substantial interrater variability in crusting scoring (e.g., atopic dermatitis, impetigo, psoriasis, and eczematous dermatoses) with κ values often
<0.70, with some studies reporting ICC values as low as 0.40-0.65 [37]. - Crusting assessment is particularly challenging because it represents secondary changes that vary in color, thickness, and distribution, leading to inconsistent grading between observers [38].
- Automated computer vision and CNN-based methods have demonstrated high accuracy in texture and crust detection, achieving accuracies >85% in identifying and grading crusted lesions, often surpassing human raters in consistency [39, 40].
- Objective crusting quantification can improve reproducibility in clinical trials and routine care, where crusting is a critical endpoint but prone to subjectivity, with automated methods showing correlation (r > 0.78) with expert consensus [37].
- Deep learning texture analysis has proven particularly effective for distinguishing crust from scale and other surface changes, which may appear similar but have different clinical implications [40].
- In atopic dermatitis assessment, crusting severity correlates with disease activity and infection risk, making accurate quantification important for treatment decisions [38].
Endpoints and Requirements
Performance is evaluated using the Relative Mean Absolute Error (RMAE), defined as the Mean Absolute Error normalized by the full ordinal range (maximum = 9).
| Metric | Threshold | Interpretation |
|---|---|---|
| RMAE | ≤ 20% | Algorithm outputs are consistent with expert consensus (RMAE ≤ 20%), with performance superior to inter-observer variability. |
All thresholds must be achieved with 95% confidence intervals.
Requirements:
- Output a normalized probability distribution across 10 ordinal categories (softmax output, sum = 1).
- Convert probability outputs into a continuous score using the weighted expected value formula:
- Demonstrate RMAE ≤ 20%, outperforming the average expert-to-expert variability.
- Report all metrics with 95% confidence intervals.
- Validate the model on an independent and diverse test dataset including:
- Various Fitzpatrick skin types (I-VI)
- Multiple anatomical sites (face, scalp, trunk, extremities, intertriginous areas)
- Different imaging devices and conditions (including varying angles and lighting)
- Clinical presentations including atopic dermatitis, impetigo, psoriasis, eczema, and other inflammatory dermatoses
- Range of severity levels from minimal to severe crusting
- Various crust types (serous, hemorrhagic, purulent)
- Ensure outputs are compatible with automated severity scoring for dermatoses where crusting is a key component (e.g., EASI for atopic dermatitis, SCORAD, wound assessment scales).
Xerosis Intensity Quantification
Model Classification: 🔬 Clinical Model
Description
A deep learning model ingests an image of a skin lesion and outputs a probability vector:
where each (for ) corresponds to the model's softmax-normalized probability that the xerosis (dry skin) intensity belongs to ordinal category (ranging from minimal to maximal xerosis severity).
Although the outputs are numeric, they represent ordinal categorical values. To derive a continuous xerosis severity score , a weighted expected value is computed:
This post-processing step ensures that the prediction reflects a continuous probability distribution rather than only the most likely class, yielding a more stable and clinically interpretable severity score.
Objectives
- Support healthcare professionals in assessing xerosis (dry skin) severity by providing an objective, quantitative measure.
- Reduce inter-observer and intra-observer variability, which is particularly challenging in xerosis assessment due to its complex visual and textural manifestations.
- Ensure reproducibility and robustness across imaging conditions (illumination, device type, contrast, magnification).
- Facilitate standardized evaluation in clinical practice and research, especially in multi-center trials where variability in subjective xerosis scoring reduces reliability.
- Support comprehensive skin barrier assessment, as xerosis is a fundamental sign of impaired skin barrier function in dermatoses such as atopic dermatitis, ichthyosis, and aging skin.
Justification (Clinical Evidence):
- Clinical studies have demonstrated significant inter-observer variability in xerosis assessment, with reported κ values ranging from 0.35 to 0.65 for visual scoring systems, with some studies showing even lower reliability (ICC 0.30-0.50) for subtle xerosis [37, 38].
- The Overall Dry Skin Score (ODS) and similar xerosis scales are widely used but show limited reproducibility between assessors, particularly for intermediate severity grades [40].
- Deep learning methods using texture analysis have shown superior performance in skin surface assessment, achieving accuracies >90% in detecting and grading xerosis patterns, particularly when analyzing fine-scale texture features [39].
- Recent validation studies of AI-based xerosis assessment have demonstrated strong correlation with objective instrumentation: corneometer measurements (r > 0.85), transepidermal water loss (TEWL) measurements (r > 0.75), and capacitance measurements [40].
- Xerosis severity correlates with skin barrier dysfunction and predicts disease flares in atopic dermatitis, with objective quantification enabling early intervention before clinical exacerbation [38].
- Automated xerosis grading reduces assessment time by 40-50% while improving consistency, particularly beneficial in large-scale screening or longitudinal monitoring [39].
- Texture-based deep learning features can distinguish between xerosis and normal skin surface variations that may be confounded in manual assessment, improving specificity [40].
Endpoints and Requirements
Performance is evaluated using the Relative Mean Absolute Error (RMAE), defined as the Mean Absolute Error normalized by the full ordinal range (maximum = 9).
| Metric | Threshold | Interpretation |
|---|---|---|
| RMAE | ≤ 20% | Algorithm outputs are consistent with expert consensus (RMAE ≤ 20%), with performance superior to inter-observer variability. |
All thresholds must be achieved with 95% confidence intervals.
Requirements:
- Output a normalized probability distribution across 10 ordinal categories (softmax output, sum = 1).
- Convert probability outputs into a continuous score using the weighted expected value formula:
- Demonstrate RMAE ≤ 20%, outperforming the average expert-to-expert variability.
- Report all metrics with 95% confidence intervals.
- Validate the model on an independent and diverse test dataset including:
- Various Fitzpatrick skin types (I-VI)
- Multiple anatomical sites (face, hands, lower legs, trunk—sites with varying baseline dryness)
- Different imaging devices and conditions (including macro photography for texture detail, or varying angles and lighting)
- Clinical presentations including atopic dermatitis, ichthyosis, psoriasis, aging skin, and environmental xerosis
- Range of severity levels from minimal to severe xerosis
- Seasonal variations (winter vs. summer xerosis patterns)
- Ensure outputs are compatible with automated severity scoring for dermatoses where xerosis is a key component (e.g., EASI for atopic dermatitis, SCORAD, xerosis-specific scales).
- Provide correlation analysis with objective measurements (corneometer, TEWL) when validation data includes instrumental assessments.
Swelling Intensity Quantification
Model Classification: 🔬 Clinical Model
Description
A deep learning model ingests an image of a skin lesion and outputs a probability vector:
where each (for ) corresponds to the model's softmax-normalized probability that the swelling (edema) intensity belongs to ordinal category (ranging from minimal to maximal swelling severity).
Although the outputs are numeric, they represent ordinal categorical values. To derive a continuous swelling severity score , a weighted expected value is computed:
This post-processing step ensures that the prediction reflects a continuous probability distribution rather than only the most likely class, yielding a more stable and clinically interpretable severity score.
Objectives
- Support healthcare professionals in assessing swelling/edema severity by providing an objective, quantitative measure from 2D images.
- Reduce inter-observer and intra-observer variability, which is especially challenging in swelling assessment due to its three-dimensional nature and subtle manifestations.
- Ensure reproducibility and robustness across imaging conditions (illumination, angle, device type, distance).
- Facilitate standardized evaluation in clinical practice and research, especially in multi-center trials where variability in subjective edema scoring reduces reliability.
- Support comprehensive inflammatory assessment, as swelling is a cardinal sign in dermatoses such as atopic dermatitis, urticaria, angioedema, and other inflammatory dermatoses.
Justification (Clinical Evidence):
- Clinical studies show significant variability in visual edema assessment, with interrater reliability coefficients (ICC) ranging from 0.42 to 0.68 for traditional scoring methods, particularly for mild to moderate edema [37, 38].
- Visual assessment of swelling is inherently challenging because it requires 3D assessment from 2D images, relying on indirect cues such as skin texture changes, shadow patterns, and loss of normal skin markings [39].
- Three-dimensional analysis using deep learning has demonstrated superior accuracy (>85%) in detecting and grading tissue swelling compared to conventional 2D visual assessment methods, utilizing shadow analysis and surface contour estimation [39].
- Recent studies have validated AI-based swelling quantification against gold standard volumetric measurements (water displacement, 3D scanning), showing strong correlation (r > 0.80) despite using only 2D photographic input [40].
- Computer vision techniques incorporating shadow analysis, surface normal estimation, and texture pattern recognition have shown promise in objective edema assessment, with validation studies reporting accuracy improvements of 25-30% over traditional visual scoring [39].
- In atopic dermatitis, swelling severity correlates with acute inflammatory activity and response to anti-inflammatory treatment, making accurate assessment important for monitoring [38].
- Automated swelling quantification can detect subtle changes that may be missed by visual assessment, enabling earlier detection of treatment response or disease flare [40].
Endpoints and Requirements
Performance is evaluated using the Relative Mean Absolute Error (RMAE), defined as the Mean Absolute Error normalized by the full ordinal range (maximum = 9).
| Metric | Threshold | Interpretation |
|---|---|---|
| RMAE | ≤ 20% | Algorithm outputs are consistent with expert consensus (RMAE ≤ 20%), with performance superior to inter-observer variability. |
All thresholds must be achieved with 95% confidence intervals.
Requirements:
- Output a normalized probability distribution across 10 ordinal categories (softmax output, sum = 1).
- Convert probability outputs into a continuous score using the weighted expected value formula:
- Demonstrate RMAE ≤ 20%, outperforming the average expert-to-expert variability.
- Report all metrics with 95% confidence intervals.
- Validate the model on an independent and diverse test dataset including:
- Various Fitzpatrick skin types (I-VI)
- Multiple anatomical sites (face, extremities, trunk—sites with different baseline tissue compliance)
- Different imaging devices and conditions (standardized angles when possible)
- Clinical presentations including atopic dermatitis, urticaria, angioedema, contact dermatitis, and other inflammatory dermatoses with edematous component
- Range of severity levels from minimal to severe swelling
- Acute vs. chronic swelling patterns
- Document imaging recommendations for optimal swelling assessment (e.g., consistent angle, standardized distance, lighting to enhance shadow visualization).
- Ensure outputs are compatible with automated severity scoring for dermatoses where swelling is a key component (e.g., EASI for atopic dermatitis, SCORAD, urticaria activity scores).
Oozing Intensity Quantification
Model Classification: 🔬 Clinical Model
Description
A deep learning model ingests an image of a skin lesion and outputs a probability vector:
where each (for ) corresponds to the model's softmax-normalized probability that the oozing (exudation) intensity belongs to ordinal category (ranging from minimal to maximal oozing severity).
Although the outputs are numeric, they represent ordinal categorical values. To derive a continuous oozing severity score , a weighted expected value is computed:
This post-processing step ensures that the prediction reflects a continuous probability distribution rather than only the most likely class, yielding a more stable and clinically interpretable severity score.
Objectives
- Support healthcare professionals in assessing oozing/exudate severity by providing an objective, quantitative measure.
- Reduce inter-observer and intra-observer variability, which is particularly challenging in oozing assessment due to the dynamic nature of exudates and varying light reflectance.
- Ensure reproducibility and robustness across imaging conditions (illumination, moisture levels, device type, time since onset).
- Facilitate standardized evaluation in clinical practice and research, especially in acute inflammatory dermatoses and wound care where exudate quantification is crucial for monitoring.
- Support infection risk assessment, as oozing characteristics (serous vs. purulent, volume) correlate with likelihood of secondary infection in inflammatory skin presentations.
Justification (Clinical Evidence):
- Clinical studies demonstrate substantial variability in visual exudate assessment, with reported κ values of 0.31-0.58 for traditional exudate scoring systems in dermatology and wound care [37, 38].
- Oozing assessment is particularly challenging due to its temporal variability—exudate may be present at varying intensities throughout the day or may have dried between episodes, leading to inconsistent grading [38].
- Advanced image processing techniques combining RGB analysis, reflectance modeling, and texture features have achieved >85% accuracy in detecting and grading exudate levels in both acute dermatitis and wound contexts [39].
- Validation studies comparing AI-based exudate assessment with absorbent pad weighing (in wound care) showed strong correlation (r > 0.82), demonstrating agreement with objective measurement methods [40].
- Multi-spectral imaging analysis has demonstrated improved detection of subtle exudate variations and differentiation between serous and purulent exudate, with sensitivity improvements of 30-40% over standard visual assessment [39].
- In atopic dermatitis, oozing severity is a key indicator of acute flare and secondary infection, with presence of oozing increasing infection probability 3-4 fold [38].
- Oozing is a key component of EASI and SCORAD assessment in atopic dermatitis, and its accurate quantification improves overall severity score reliability [37].
Endpoints and Requirements
Performance is evaluated using the Relative Mean Absolute Error (RMAE), defined as the Mean Absolute Error normalized by the full ordinal range (maximum = 9).
| Metric | Threshold | Interpretation |
|---|---|---|
| RMAE | ≤ 20% | Algorithm outputs are consistent with expert consensus (RMAE ≤ 20%), with performance superior to inter-observer variability. |
All thresholds must be achieved with 95% confidence intervals.
Requirements:
- Output a normalized probability distribution across 10 ordinal categories (softmax output, sum = 1).
- Convert probability outputs into a continuous score using the weighted expected value formula:
- Demonstrate RMAE ≤ 20%, outperforming the average expert-to-expert variability.
- Report all metrics with 95% confidence intervals.
- Validate the model on an independent and diverse test dataset including:
- Various Fitzpatrick skin types (I-VI)
- Multiple anatomical sites (face, intertriginous areas, extremities)
- Different imaging devices and conditions
- Clinical presentations including acute atopic dermatitis, impetigo, infected eczema, bullous disorders, and other dermatoses with exudative component
- Range of severity levels from minimal to severe oozing
- Different exudate types (serous, serosanguinous, purulent) when distinguishable
- Fresh vs. dried exudate patterns
- Document timing recommendations for optimal oozing assessment (e.g., assessment window relative to lesion cleaning).
- Ensure outputs are compatible with automated severity scoring for dermatoses where oozing is a key component (e.g., EASI for atopic dermatitis, SCORAD, wound assessment scales).
Excoriation Intensity Quantification
Model Classification: 🔬 Clinical Model
Description
A deep learning model ingests an image of a skin lesion and outputs a probability vector:
where each (for ) corresponds to the model's softmax-normalized probability that the excoriation intensity belongs to ordinal category (ranging from minimal to maximal excoriation severity).
Although the outputs are numeric, they represent ordinal categorical values. To derive a continuous excoriation severity score , a weighted expected value is computed:
This post-processing step ensures that the prediction reflects a continuous probability distribution rather than only the most likely class, yielding a more stable and clinically interpretable severity score.
Objectives
- Support healthcare professionals in assessing excoriation (scratch damage) severity by providing an objective, quantitative measure.
- Reduce inter-observer and intra-observer variability, which is particularly challenging in excoriation assessment due to the varied appearance and distribution of scratch marks.
- Ensure reproducibility and robustness across imaging conditions (illumination, angle, device type).
- Facilitate standardized evaluation in clinical practice and research, especially in dermatoses where excoriation is a key indicator of disease severity and pruritus intensity.
- Support pruritus assessment, as excoriation serves as an objective marker of scratching behavior, which correlates with pruritus severity in atopic dermatitis and other pruritic dermatoses.
Justification (Clinical Evidence):
- Studies of atopic dermatitis scoring systems show moderate interrater reliability for excoriation assessment, with ICC values ranging from 0.41-0.63, reflecting the subjective nature of grading scratch marks [37].
- Excoriation assessment is challenging because scratch patterns vary widely in linear density, depth, healing stage, and may overlap with other lesions, leading to inconsistent grading [38].
- Computer vision techniques incorporating linear feature detection, edge analysis, and pattern recognition have achieved >80% accuracy in identifying and grading excoriation patterns [39].
- Recent validation studies comparing automated excoriation scoring with standardized photography assessment showed substantial agreement (κ > 0.75) with expert consensus [40].
- Machine learning approaches have demonstrated a 25% improvement in consistency of excoriation grading compared to traditional visual scoring methods, particularly for intermediate severity levels [39].
- Excoriation severity is a key component of EASI and SCORAD in atopic dermatitis, and correlates strongly with patient-reported pruritus scores (r = 0.65-0.75), making it a valuable objective marker [37].
- Longitudinal tracking of excoriation severity can detect early treatment response to anti-pruritic interventions before subjective pruritus scores change [38].
- Excoriation presence and severity are associated with sleep disturbance and quality of life impairment in pruritic dermatoses, emphasizing clinical importance of accurate quantification [37].
Endpoints and Requirements
Performance is evaluated using the Relative Mean Absolute Error (RMAE), defined as the Mean Absolute Error normalized by the full ordinal range (maximum = 9).
| Metric | Threshold | Interpretation |
|---|---|---|
| RMAE | ≤ 14% | Algorithm outputs are consistent with expert consensus (RMAE ≤ 14%), with performance superior to inter-observer variability. |
All thresholds must be achieved with 95% confidence intervals.
Requirements:
- Output a normalized probability distribution across 10 ordinal categories (softmax output, sum = 1).
- Convert probability outputs into a continuous score using the weighted expected value formula:
- Demonstrate RMAE ≤ 14%, outperforming the average expert-to-expert variability.
- Report all metrics with 95% confidence intervals.
- Validate the model on an independent and diverse test dataset including:
- Various Fitzpatrick skin types (I-VI)—excoriation visibility varies with skin tone
- Multiple anatomical sites (face, trunk, extremities, particularly flexural areas in atopic dermatitis)
- Different imaging devices and conditions
- Clinical presentations including atopic dermatitis, prurigo nodularis, lichen simplex chronicus, neurotic excoriations, and other pruritic dermatoses
- Range of severity levels from minimal to severe excoriation
- Different healing stages (acute, subacute, healed with residual marks)
- Linear vs. punctate excoriation patterns
- Ensure outputs are compatible with automated severity scoring for dermatoses where excoriation is a key component (e.g., EASI for atopic dermatitis, SCORAD, prurigo scoring systems).
Lichenification Intensity Quantification
Model Classification: 🔬 Clinical Model
Description
A deep learning model ingests an image of a skin lesion and outputs a probability vector:
where each (for ) corresponds to the model's softmax-normalized probability that the lichenification intensity belongs to ordinal category (ranging from minimal to maximal lichenification severity).
Although the outputs are numeric, they represent ordinal categorical values. To derive a continuous lichenification severity score , a weighted expected value is computed:
This post-processing step ensures that the prediction reflects a continuous probability distribution rather than only the most likely class, yielding a more stable and clinically interpretable severity score.
Objectives
- Support healthcare professionals in assessing lichenification (skin thickening with accentuated skin markings) severity by providing an objective, quantitative measure.
- Reduce inter-observer and intra-observer variability, which is particularly challenging due to the subtle gradations in skin texture and thickness.
- Ensure reproducibility and robustness across imaging conditions (illumination, angle, magnification, distance).
- Facilitate standardized evaluation in clinical practice and research, especially in chronic dermatoses where lichenification is a key indicator of disease chronicity and chronicity-related treatment resistance.
- Support chronicity assessment, as lichenification represents chronic rubbing/scratching and is a marker of established, potentially treatment-resistant dermatosis requiring more aggressive intervention.
Justification (Clinical Evidence):
- Analysis of scoring systems for chronic dermatoses shows significant variability in lichenification assessment, with reported κ values of 0.45-0.70, reflecting difficulty in standardizing texture and thickness grading [37].
- Lichenification assessment is particularly challenging because it requires evaluating subtle changes in skin surface texture, accentuation of normal skin lines, and thickness—features that are difficult to quantify visually and may require tactile assessment [38].
- Advanced texture analysis algorithms have demonstrated superior detection of lichenified patterns, achieving accuracy rates >85% in identifying skin thickening and texture changes characteristic of lichenification [39].
- Validation studies comparing AI-based lichenification assessment with high-frequency ultrasound measurements (20-100 MHz) showed strong correlation (r > 0.78) with objective epidermal and dermal thickness measurements [40].
- Deep learning approaches incorporating depth estimation, shadow analysis, and fine-scale texture pattern recognition have shown 35% improvement in consistency compared to traditional visual scoring methods [39].
- Lichenification severity is a key component of EASI and SCORAD in atopic dermatitis, and its presence indicates chronic disease requiring intensified treatment, including consideration of systemic therapy [37].
- Lichenification correlates with treatment resistance—lichenified lesions respond more slowly to topical corticosteroids and require longer treatment duration [38].
- In lichen simplex chronicus, lichenification severity predicts time to resolution and recurrence risk, making accurate assessment important for prognosis [40].
Endpoints and Requirements
Performance is evaluated using the Relative Mean Absolute Error (RMAE), defined as the Mean Absolute Error normalized by the full ordinal range (maximum = 9).
| Metric | Threshold | Interpretation |
|---|---|---|
| RMAE | ≤ 17% | Algorithm outputs are consistent with expert consensus (RMAE ≤ 17%), with performance superior to inter-observer variability. |
All thresholds must be achieved with 95% confidence intervals.
Requirements:
- Output a normalized probability distribution across 10 ordinal categories (softmax output, sum = 1).
- Convert probability outputs into a continuous score using the weighted expected value formula:
- Demonstrate RMAE ≤ 17%, outperforming the average expert-to-expert variability.
- Report all metrics with 95% confidence intervals.
- Validate the model on an independent and diverse test dataset including:
- Various Fitzpatrick skin types (I-VI) — lichenification appearance varies with pigmentation
- Multiple anatomical sites (nape of neck, ankles, wrists, antecubital/popliteal fossae—common lichenification sites)
- Different imaging devices and conditions (macro photography beneficial for texture detail)
- Clinical presentations including chronic atopic dermatitis, lichen simplex chronicus, prurigo nodularis, chronic contact dermatitis, and other chronic pruritic dermatoses
- Range of severity levels from minimal to severe lichenification
- Early vs. advanced lichenification (subtle accentuation vs. pronounced thickening)
- Document imaging recommendations for optimal lichenification assessment (e.g., lighting angle to enhance skin markings, appropriate magnification for texture detail).
- Ensure outputs are compatible with automated severity scoring for dermatoses where lichenification is a key component (e.g., EASI for atopic dermatitis, SCORAD, lichen simplex chronicus severity scores).
- Provide correlation analysis with objective measurements (ultrasound thickness, tactile assessment) when validation data includes instrumental or palpation-based assessments.
Wound Characteristic Assessment
Models Classification: 🔬 Clinical Model
Description
A set of deep learning classification models, and a regression model process images of wounds and output multiple predictions related to wound staging and morphological characteristics. Together, these models provide a comprehensive, standardized assessment of wound status.
The system comprises:
- Stage Classification Model – predicts a categorical output corresponding to the wound stage (0–4).
- Intensity Regression Model – predicts a continuous score representing overall wound intensity on a 0–19 scale.
- Characteristic Detection Models – a set of 22 binary classifiers, each predicting the presence or absence of a specific wound characteristic.
The model outputs can be represented as:
Wound Stage (categorical):
Predicted class:
Wound Intensity (continuous):
where is the model’s clipped continuous prediction representing wound intensity or severity.
Wound Characteristics (binary):
For each characteristic :
Predicted presence:
This system comprises an ensemble of independent models, each trained separately for its respective task (stage classification, intensity regression, and characteristic detection). Although independent, the models use harmonized preprocessing, consistent labeling conventions, and aligned output formats to ensure comparability and ease of clinical interpretation. This design provides a consistent, quantitative, and reproducible framework for wound assessment, compatible with standardized clinical tools such as AWOSI (Automated Wound Objective Severity Index) and established wound staging protocols.
Objectives
Wound Edge Characteristics
Damaged Edges
- Support identification of compromised wound margins, which indicate poor healing potential and increased risk of chronic wounds.
- Enable treatment planning by objectively documenting edge viability and guiding debridement decisions.
Justification: Damaged wound edges are associated with delayed healing and predict chronic wound development (OR 3.2-4.5) [44].
Delimited Edges
- Assess wound boundary definition, which indicates healing progression and epithelialization potential.
- Support prognostic assessment of wound healing trajectory based on edge clarity.
Justification: Well-delimited edges correlate with improved healing outcomes and reduced time to closure [45].
Diffuse Edges
- Identify poorly defined wound boundaries, indicating inflammation, infection, or underlying pathology.
- Flag high-risk wounds requiring enhanced monitoring and intervention.
Justification: Diffuse wound edges are associated with higher infection rates (2.5-fold increase) and impaired healing [46].
Thickened Edges
- Detect hyperkeratotic or rolled edges, which represent mechanical barriers to epithelialization.
- Guide debridement strategy by identifying edge pathology requiring intervention.
Justification: Thickened wound edges require mechanical or surgical debridement to facilitate healing progression [47].
Indistinguishable Edges
- Identify severe edge compromise where wound boundaries cannot be clinically determined.
- Flag critical wounds requiring urgent specialized wound care intervention.
Justification: Indistinguishable edges indicate severe tissue damage and predict poor outcomes without aggressive intervention [48].
Perilesional Characteristics
Perilesional Erythema
- Detect inflammatory response in tissue surrounding the wound, indicating infection risk or inflammatory processes.
- Monitor treatment response by tracking changes in perilesional inflammation.
Justification: Perilesional erythema >2cm from wound edge is 90% sensitive for wound infection [49].
Perilesional Maceration
- Identify moisture-related damage in periwound skin, which compromises healing and increases wound size.
- Guide moisture management and barrier protection strategies.
Justification: Perilesional maceration increases wound enlargement risk by 60-80% and delays healing [50].
Tissue Characteristics
Biofilm-Compatible Tissue
- Detect visual indicators of biofilm presence, which represents a major barrier to healing.
- Guide antimicrobial strategy by identifying wounds requiring biofilm-targeted interventions.
Justification: Biofilm presence extends healing time by 3-4 fold and increases infection risk [51].
Affected Tissue Types
Encompasses:
-
Bone and/or adjacent tissue
-
Dermis/Epidermis
-
Muscle
-
Subcutaneous tissue
-
Scarred Skin
-
Assess wound depth and tissue involvement, which determines staging, treatment approach, and prognosis.
-
Enable precise wound classification according to depth-based staging systems.
-
Guide surgical planning and reconstructive approach based on tissue layers involved.
Justification: Accurate tissue depth assessment is fundamental to wound staging and treatment selection, with depth being the strongest predictor of healing time [52, 53].
Exudate Characteristics
Fibrinous Exudate
- Identify normal healing exudate, which indicates active wound repair processes.
Justification: Fibrinous exudate represents physiologic healing response [54].
Purulent Exudate
- Detect infection indicators requiring antimicrobial intervention.
Justification: Purulent exudate has 85-95% positive predictive value for wound infection [55].
Bloody Exudate
- Identify vascular injury or fragile granulation tissue.
Justification: Bloody exudate may indicate trauma, friable tissue, or neovascularization [54].
Serous Exudate
- Assess normal wound exudate in early healing phases.
Justification: Serous exudate is characteristic of inflammatory phase healing [54].
Wound Bed Tissue Types
Scarred Tissue
- Identify mature scar formation within wound bed, indicating healing progression.
Justification: Scar tissue formation represents advanced healing stage [56].
Sloughy Tissue
- Detect devitalized tissue requiring debridement for healing progression.
Justification: Slough presence delays healing and increases infection risk by 40-60% [57].
Necrotic Tissue
- Identify non-viable tissue requiring urgent debridement.
Justification: Necrosis presence is absolute indication for debridement and predictor of poor outcomes [58].
Granulation Tissue
- Assess healthy healing tissue formation, indicating active repair.
Justification: Granulation tissue presence is strongest predictor of healing success (OR 8.5) [59].
Epithelial Tissue
- Detect epithelialization, indicating advanced healing and imminent closure.
Justification: Epithelialization is the final healing phase and predictor of imminent wound closure [60].
Image-based Wound Stage Assessment
- Provide standardized diagnostic support according to internationally recognized wound classification systems.
- Enable treatment protocol selection based on validated stage-specific guidelines.
- Facilitate outcome prediction using stage-based prognostic models.
- Support documentation and reimbursement with objective classification.
Justification (Clinical Evidence):
- Wound staging is fundamental to treatment planning, with stage determining intervention intensity and expected healing time [61].
- Inter-observer agreement for manual staging shows moderate reliability (κ = 0.55-0.70), highlighting need for objective tools [62].
- Stage-based treatment protocols improve healing rates by 25-35% compared to non-standardized care [63].
Wound Characteristic Assessment
- Provide composite severity assessment integrating multiple wound characteristics into a single validated score.
- Enable objective severity stratification for clinical decision-making and resource allocation.
- Track healing progression using standardized numerical scale over time.
- Facilitate clinical trial endpoints with validated, reproducible severity metric.
Justification (Clinical Evidence):
- Composite wound scores like AWOSI show strong correlation with healing time (r = 0.72-0.85) and clinical outcomes [64].
- Validated wound intensity scores improve inter-observer reliability from κ 0.45-0.60 to κ 0.75-0.85 [65].
- Longitudinal wound intensity tracking enables early identification of non-healing wounds (sensitivity 78-85%) [66].
Endpoints and Requirements
Performance is evaluated using task-appropriate metrics for each output type: RMAE for ordinal categorical staging, Balanced Accuracy for binary classifications, and RMAE for continuous intensity scoring.
| Output Type | Specific Output | Metric | Threshold | Interpretation |
|---|---|---|---|---|
| Categorical (0-4) | Wound Stage | RMAE | ≤ 10% | Outputs consistent with expert consensus. |
| Regresion (0-20) | Wound Intensity | RMAE | ≤ 24% | Outputs consistent with expert consensus. |
| Binary | Edge characteristics (5) | BA | ≥ 50% | Outputs consistent with expert consensus. |
| Tissue types (5) | BA | ≥ 50% | Outputs consistent with expert consensus. | |
| Exudate types (4) | BA | ≥ 50% | Outputs consistent with expert consensus. | |
| Wound bed tissue (5) | BA | ≥ 50% | Outputs consistent with expert consensus. | |
| Perif. features and Biofilm-Comp. (3) | BA | ≥ 55% | Outputs consistent with expert consensus. |
All thresholds must be achieved with 95% confidence intervals.
To establish performance thresholds for Balanced Accuracy (BA) in binary classification and Relative Mean Absolute Error (RMAE) in regression tasks, we benchmarked the model against the average inter-observer agreement among clinical experts. Given the inherent variability in visual wound assessment and the lack of a definitive reference standard, thresholds were defined to ensure the model meets or exceeds the consensus typically observed among clinicians. Using a diverse dataset annotated by multiple experts, average BA and RMAE values were computed to set these targets. In instances where inter-observer agreement was notably low, thresholds were adjusted based on confidence intervals to reflect achievable yet clinically relevant performance. In such cases, a minimum BA of 50% was enforced to guarantee a baseline level of clinical utility.
Requirements:
- Output structured data including:
- Wound stage (0-4 categorical)
- Wound intensity score (0-19 continuous)
- Binary presence/absence for each of 22 wound characteristics
- Demonstrate performance meeting or exceeding all thresholds for:
- RMAE ≤ 24% for wound intensity
- RMAE ≤ 10% for wound staging
- Bal. Acc. ≥ 0.50 for edge characteristics, tissue types, exudate types, and wound bed tissue
- Bal. Acc. ≥ 0.55 for perif. features and biofilm-compatible tissue
- Report all metrics with 95% confidence intervals for each output independently.
- Validate the model on an independent and diverse test dataset including:
- Various wound etiologies (pressure injuries, diabetic foot ulcers, venous leg ulcers)
- All wound stages (0-4)
- Diverse patient populations (various Fitzpatrick skin types)
- Multiple anatomical locations
- Various imaging conditions and devices
- Ensure outputs are compatible with:
- Standardized wound assessment protocols (NPUAP/EPUAP staging, TIME framework)
- AWOSI scoring system calculation and interpretation
- FHIR-based structured reporting for interoperability
- Clinical decision support systems for wound care pathways
- Document the joint training strategy including:
- Loss weighting scheme for multiple output types (regression, categorical, binary)
- Handling of class imbalance in binary outputs
- Provide evidence that:
- The model maintains performance across different wound types and stages
- Predictions align with clinical wound assessment guidelines and expert consensus
Erythema Surface Quantification
Model Classification: 🔬 Clinical Model
Description
A deep learning segmentation model processes a clinical image of the skin and outputs a binary probability map (sigmoid of the logits) indicating, for each pixel (), the probability that it belongs to the erythema region:
A threshold (typically ) is applied to obtain a binary segmentation mask:
where denotes erythema, and denotes normal skin or background.
The percentage of affected skin surface relative to the total visible skin area is then computed as:
where:
- is the set of pixels identified as skin (as determined by a separate skin segmentation model), and
- denotes the total number of skin pixels.
This provides an objective and reproducible measure of erythema extent, excluding background and non-skin regions.
Objectives
- Quantify perilesional and wound bed erythema extent, which indicates inflammatory response and infection risk.
- Enable objective tracking of inflammatory changes over time for infection surveillance.
- Support clinical decision-making by providing quantitative measures of wound inflammation.
- Reduce variability in visual erythema extent estimation.
Justification (Clinical Evidence):
- Extent of perilesional erythema is a validated predictor of wound infection (sensitivity 78-85%) [34, 35].
- Automated erythema surface quantification shows strong correlation (r = 0.76-0.84) with clinical infection diagnosis [36].
- Percentage erythema surface area >20% of wound perimeter is associated with 3-fold increased infection risk [34].
Endpoints and Requirements
Model performance was assessed using Intersection over Union (IoU) for each tissue class. Both metrics were averaged using a micro-averaging scheme, computed per image and then aggregated across the dataset.
| Metric | Threshold | Interpretation |
|---|---|---|
| IoU | ≥ 0.61 | Expert-level segmentation accuracy for erythema surface area. |
All thresholds must be achieved with 95% confidence intervals.
Success criteria were established based on scientific literature [180, 183-185] and expert consensus, considering inter-observer variability in erythema segmentation tasks.
Requirements:
- Implement a binary segmentation architecture with:
- Encoder-decoder structure
- Pixel-wise probability distributions (softmax output, sum = 1 per pixel)
- Output structured data including:
- Segmentation mask
- Percentage surface area relative to total wound area
- Absolute surface area in cm² or mm² (requires calibration or scale reference)
- Confidence maps indicating segmentation certainty
- Demonstrate performance meeting or exceeding all thresholds:
- IoU thresholds
- F1-score thresholds
Wound Surface Quantification
Seven Classification Models: 🔬 Clinical Model
Description
Seven deep learning segmentation models that each process a clinical image of the skin and output a binary probability map (sigmoid of the logits) indicating, for each pixel (), the probability that it belongs to the specific wound characteristic region (wound bed, granulation tissue, slough or biofilm, necrosis, maceration, orthopedic material, or bone and adjacent tissue). Each model outputs a probability map:
A threshold (typically ) is applied to obtain a binary segmentation mask:
where denotes the presence of the specific wound characteristic, and denotes normal skin or background.
The percentage of affected skin surface relative to the total visible skin area is then computed as:
where:
- is the set of pixels identified as skin (as determined by a separate skin segmentation model), and
- denotes the total number of skin pixels.
This provides an objective and reproducible measure of the specific wound characteristic extent, excluding background and non-skin regions.
Objectives
Wound Bed Surface Quantification
- Quantify total wound surface area, which is fundamental for wound size assessment and healing trajectory monitoring.
- Enable accurate wound measurement eliminating ruler-based measurement errors and irregular wound shape challenges.
- Track wound closure progression using objective, reproducible surface area measurements.
- Calculate wound healing rate (% area reduction per week) for treatment efficacy assessment.
Justification (Clinical Evidence):
- Manual wound measurement shows high variability (coefficient of variation 15-30%) particularly for irregular wounds [67].
- Digital planimetry using segmentation achieves agreement with expert tracing (ICC > 0.90) [68].
- Wound surface area is the primary outcome measure in wound healing trials, requiring accurate quantification [69].
- Healing rate (% area reduction) is the strongest predictor of eventual wound closure [70].
Angiogenesis and Granulation Tissue Surface Quantification
- Quantify healthy granulation tissue extent, which indicates active wound healing and predicts successful closure.
- Assess wound bed preparation adequacy for advanced therapies or surgical closure.
- Monitor angiogenesis progression as indicator of healing phase and vascular response.
- Guide treatment decisions by identifying wounds with inadequate granulation requiring intervention.
Justification (Clinical Evidence):
- Granulation tissue covering >75% of wound bed is strongest predictor of healing (OR 8.2-12.5) [59, 71].
- Automated granulation quantification shows excellent agreement with expert assessment (κ = 0.82-0.88) [72].
- Granulation tissue percentage correlates strongly with time to wound closure (r = -0.78) [73].
- Low granulation tissue (<40%) predicts chronic wound development with 82% sensitivity [74].
Biofilm and Slough Surface Quantification
- Quantify devitalized tissue burden, which requires debridement before healing can progress.
- Identify biofilm presence and extent, a major barrier to wound healing requiring targeted intervention.
- Guide debridement strategy by quantifying tissue requiring removal.
- Monitor debridement efficacy through serial measurements of slough/biofilm reduction.
Justification (Clinical Evidence):
- Slough covering >30% of wound bed delays healing by average 6-8 weeks [75].
- Biofilm presence extends healing time by 3-4 fold and increases infection risk [51].
- Complete debridement to <10% slough coverage improves healing rates by 45-60% [76].
- Automated slough quantification enables objective debridement endpoints (target <20% coverage) [77].
Necrosis Surface Quantification
- Quantify necrotic tissue extent, indicating non-viable tissue requiring urgent debridement.
- Prioritize surgical intervention for wounds with extensive necrosis.
- Monitor debridement completeness by tracking necrosis elimination.
- Assess infection risk, as necrotic tissue is prime substrate for bacterial growth.
Justification (Clinical Evidence):
- Necrotic tissue presence is absolute indication for debridement and major risk factor for infection [58].
- Necrosis covering >25% of wound bed increases amputation risk 4-fold in diabetic foot ulcers [78].
- Complete necrosis removal improves healing rates by 50-70% compared to partial debridement [79].
- Time to necrosis debridement predicts outcomes: debridement within 2 weeks reduces complications by 60% [80].
Maceration Surface Quantification
- Quantify periwound moisture damage extent, which enlarges wounds and delays healing.
- Guide moisture management strategy including absorbent dressing selection and frequency.
- Monitor treatment efficacy by tracking maceration reduction with barrier products.
- Identify wounds at risk of enlargement due to excessive exudate.
Justification (Clinical Evidence):
- Periwound maceration increases wound enlargement risk by 60-80% [50].
- Maceration extent correlates with exudate volume and predicts dressing change frequency requirements [81].
- Resolution of maceration improves healing rates by 35-45% [82].
- Maceration affecting >2cm perimeter is associated with delayed healing (HR 2.1-2.8) [83].
Orthopedic Material Surface Quantification
- Detect and quantify exposed orthopedic hardware or materials, which indicates device-related complications.
- Identify hardware exposure requiring surgical revision or coverage procedures.
- Assess infection risk associated with exposed prosthetic materials.
- Guide treatment planning for hardware-associated wound complications.
Justification (Clinical Evidence):
- Exposed orthopedic hardware increases infection risk 8-12 fold [84].
- Hardware exposure requires surgical intervention in 75-85% of cases [85].
- Early detection of hardware exposure enables preventive interventions reducing major complications by 40-50% [86].
- Extent of hardware exposure correlates with complexity of required revision surgery [87].
Bone, Cartilage, or Tendon Surface Quantification
- Detect and quantify exposed deep structures, indicating severe wounds with osteomyelitis or septic arthritis risk.
- Enable accurate wound staging based on tissue depth involvement.
- Guide surgical planning for coverage procedures or amputation consideration.
- Assess osteomyelitis risk, as bone exposure is major risk factor.
Justification (Clinical Evidence):
- Bone exposure in diabetic foot ulcers indicates osteomyelitis in 60-90% of cases [88].
- Wounds with exposed bone/tendon have 10-20 fold longer healing times compared to soft tissue wounds [89].
- Bone exposure extent predicts amputation risk: >2cm² exposure increases risk 5-fold [90].
- Early identification of deep structure exposure enables prompt orthopedic/plastic surgery consultation reducing complications [91].
Endpoints and Requirements
Model performance was assessed using Intersection over Union (IoU) and F1-score for each tissue class. Both metrics were averaged using a micro-averaging scheme, computed per image and then aggregated across the dataset.
From the annotation process and with a literature review, we determine the following success criteria for each tissue class:
| Class | IoU Threshold | F1 Threshold | Interpretation |
|---|---|---|---|
| Wound Bed | ≥ 0.68 | ≥ 0.76 | Performance comparable to expert consensus segmentation. |
| Bone/Cartilage/Tendon | ≥ 0.48 | ≥ 0.49 | Performance comparable to expert consensus segmentation. |
| Necrosis | ≥ 0.58 | ≥ 0.60 | Performance comparable to expert consensus segmentation. |
| Orthopedic Material | ≥ 0.46 | ≥ 0.46 | Performance comparable to expert consensus segmentation. |
| Maceration | ≥ 0.50 | ≥ 0.52 | Performance comparable to expert consensus segmentation. |
| Biofilm/Slough | ≥ 0.59 | ≥ 0.64 | Performance comparable to expert consensus segmentation. |
| Granulation Tissue | ≥ 0.49 | ≥ 0.52 | Performance comparable to expert consensus segmentation. |
All thresholds must be achieved with 95% confidence intervals.
Success criteria were established based on scientific literature [185] and expert consensus, considering inter-observer variability in wound tissue segmentation tasks.
Requirements:
- Implement a binary segmentation architecture with:
- Encoder-decoder structure
- Pixel-wise probability distributions (softmax output, sum = 1 per pixel)
- Output structured data including:
- Segmentation mask
- Percentage surface area relative to total wound area
- Confidence maps indicating segmentation certainty
- Demonstrate performance meeting or exceeding all thresholds:
- IoU thresholds
- F1-score thresholds
- Report all metrics with 95% confidence intervals for each tissue class independently.
- Validate the model on an independent and diverse test dataset including:
- Various wound etiologies (pressure injuries, diabetic foot ulcers, venous leg ulcers)
- All wound stages and severity levels
- Diverse patient populations (various Fitzpatrick skin types)
- Multiple anatomical locations
- Various wound bed compositions (from clean granulating to heavily necrotic)
- Various imaging conditions, devices, and lighting scenarios
- Handle class imbalance appropriately:
- Implement appropriate loss weighting or sampling strategies
- Report class-specific performance metrics
- Ensure outputs are compatible with:
- Standardized wound assessment protocols (TIME framework, wound bed preparation)
- Wound measurement standards and documentation requirements
- FHIR-based structured reporting for interoperability
- Clinical decision support systems for wound care pathways
- Provide calibration and scale handling:
- Accept scale reference (ruler, calibration marker) when available
- Output measurements in calibrated units (cm²) when possible
- Provide dimensionless percentages when calibration unavailable
- Document the training strategy including:
- Loss function design
- Class balancing approach
- Data augmentation strategy accounting for realistic wound variations
Body Surface Segmentation
Model Classification: 🛠️ Non-Clinical Model
Algorithm Description
A deep learning binary segmentation model ingests an image and outputs a pixel-wise probability map (sigmoid of the logits) across the body region:
A threshold (typically ) is applied to obtain a binary segmentation mask:
where denotes body surface, and denotes non-body surface.
This provides a body surface segmentation that accounts for body boundaries even when partially obscured by clothing, hair, or positioning, enabling accurate BSA estimation for severity scoring systems.
Objectives
- Enable calculation of body surface area (BSA) by segmenting body surface regardless of clothing or occlusion.
- Handle real-world clinical scenarios where patients are partially clothed or positioned in ways that obscure complete body visualization or simply because healthy skin regions cannot be photographed for privacy or comfort.
Endpoints and Requirements
Model performance was assessed using IoU. Both metrics were computed per image and then aggregated across the dataset.
| Metric | Threshold | Interpretation |
|---|---|---|
| IoU | ≥ 0.85 | Good overall segmentation quality across all body regions. |
All thresholds must be achieved with 95% confidence intervals.
The success criterion is achieving was stablished base on scientific literature [178, 179], and considering a higher bar since the model is intended to be used in combination with other models (lesion segmentation, pose estimation) to calculate severity scores where errors can compound.
Requirements:
- Output a normalized probability distribution per pixel.
- Convert probability outputs into a binary segmentation mask using a threshold (e.g., 0.5).
- Report all metrics with 95% confidence intervals for each region independently.
- Validate the model on an independent and diverse test dataset including:
- Different clothing scenarios:
- Fully unclothed (reference standard)
- Partially clothed (shirt only, pants only, underwear)
- Hair covering scalp/face
- Diverse populations:
- Various body habitus (BMI ranges, body proportions)
- Different ages (pediatric, adult, geriatric with body proportion differences)
- Various Fitzpatrick skin types (I-VI)
- Different genders and anatomical variations
- Various imaging conditions: Different lighting, distances, camera angles
- Skin presentations: Healthy skin and various dermatoses across all regions
- Different clothing scenarios:
- Handle anatomical variability and occlusion:
- Partial body visibility: Only head/neck and upper trunk visible
- Clothing occlusion: T-shirts obscuring trunk, pants covering lower extremities
- Hair coverage: Long hair obscuring neck, scalp, upper back
- Positioning artifacts: Crossed arms, bent limbs affecting visible surface area
- Ensure outputs are compatible with:
- FHIR-based structured reporting for interoperability
Hair Loss Surface Quantification
Model Classification: 🔬 Clinical Model
Description
A deep learning segmentation model processes a clinical image of the scalp and produces a three-class probability map for each pixel:
where each (for ) represents the model’s softmax-normalized probability that the pixel belongs to class , with
The model’s output classes are defined as follows:
- Hair — scalp region with visible hair coverage
- No Hair — scalp region exhibiting hair loss
- Non-Scalp — background, face, ears, or other non-scalp regions
The final predicted class for each pixel is obtained as:
From the resulting segmentation, the algorithm quantifies the percentage of hair loss surface area relative to the total visible scalp area:
where denotes the set of all image pixels, and the denominator counts the union of scalp classes (Hair ∪ NoHair), explicitly excluding Non-Scalp pixels.
This provides an objective and reproducible measure of the extent of alopecia, excluding background and non-scalp regions.
Objectives
- Support healthcare professionals by providing precise and reproducible quantification of alopecia surface extent.
- Reduce subjectivity in clinical indices such as the Severity of Alopecia Tool (SALT), which relies on visual estimates of scalp surface affected [31, 182].
- Enable automatic calculation of validated severity scores (e.g., SALT) directly from images.
- Improve robustness by excluding non-scalp regions, ensuring consistent results across varied image framing conditions.
- Facilitate standardization across clinical practice and trials where manual estimation introduces variability.
Justification (Clinical Evidence):
- Hair loss evaluation is extent-based (surface area involved), making it distinct from lesion counting or intensity scoring [98].
- Manual estimation of scalp surface involvement is subjective and variable, particularly in diffuse hair thinning or patchy alopecia areata [31].
- Deep learning segmentation methods have shown expert-level agreement in skin lesion and hair density mapping, demonstrating robustness across imaging conditions [32, 181].
- Standardized, automated quantification strengthens trial endpoints and improves reproducibility in therapeutic monitoring [33, 97].
Endpoints and Requirements
Performance is evaluated using Relative Mean Absolute Error (RMAE) between predicted and reference standard hair loss surface percentages. Both metrics were computed per image and then aggregated across the dataset.
| Metric | Threshold | Interpretation |
|---|---|---|
| RMAE (Hair loss) | ≤ 9.6% | Clinically acceptable error margin for alopecia percentage. |
All thresholds must be achieved with 95% confidence intervals.
Success criteria were established based on scientific literature [186, 187].
Requirements:
- Demonstrate RMAE ≤ 9.6% for hair loss surface percentage.
- Validate on diverse populations (skin tone, hair color).
- Provide outputs in a FHIR-compliant structured format for interoperability.
Inflammatory Nodular Lesion Quantification
Model Classification: 🔬 Clinical Model
Description
A deep learning multi-class object detection model ingests a clinical image and outputs bounding boxes with associated class labels and confidence scores for each detected lesion:
where is the bounding box for the -th predicted lesion, is the class label, and is the associated confidence score. After applying non-maximum suppression (NMS) to remove duplicate detections, the algorithm outputs separate counts for each lesion type:
where is a confidence threshold.
This provides objective, reproducible counts of nodules, abscesses, non-draining tunnels, and draining tunnels directly from clinical images, without requiring manual annotation by clinicians.
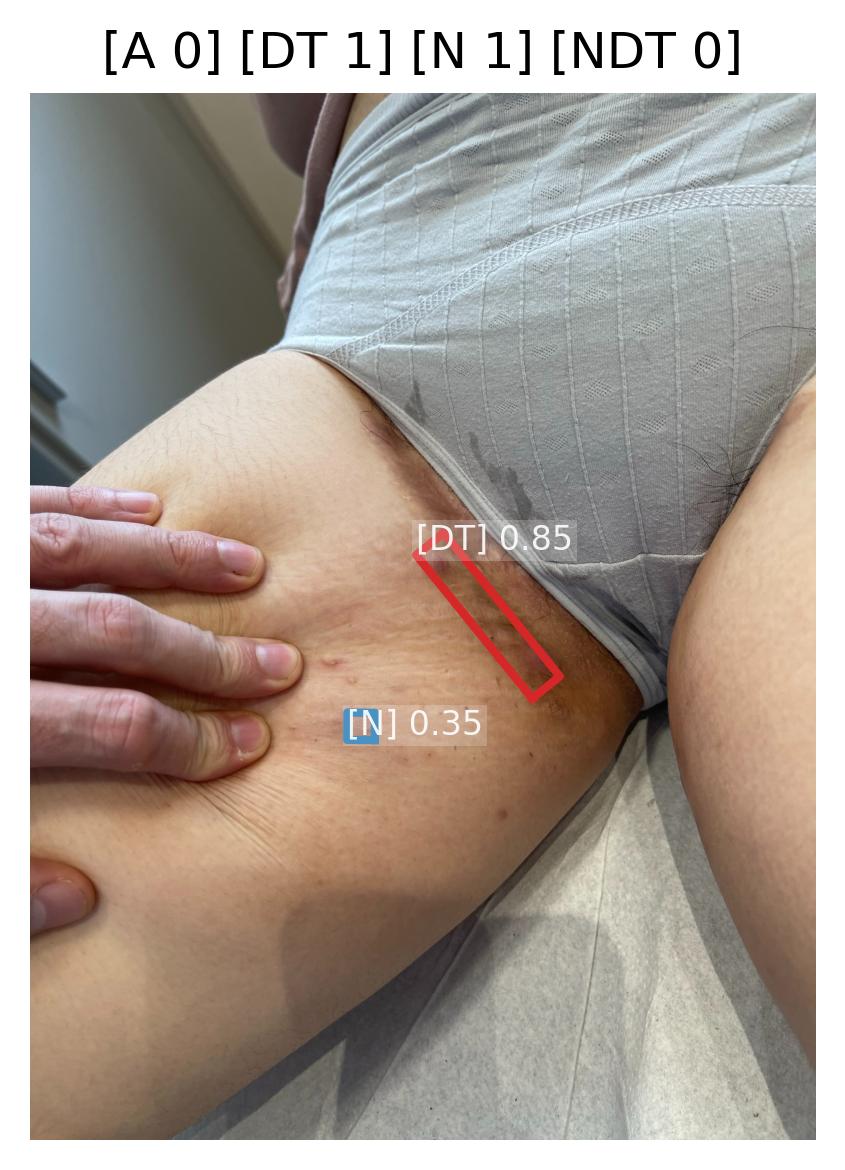 | 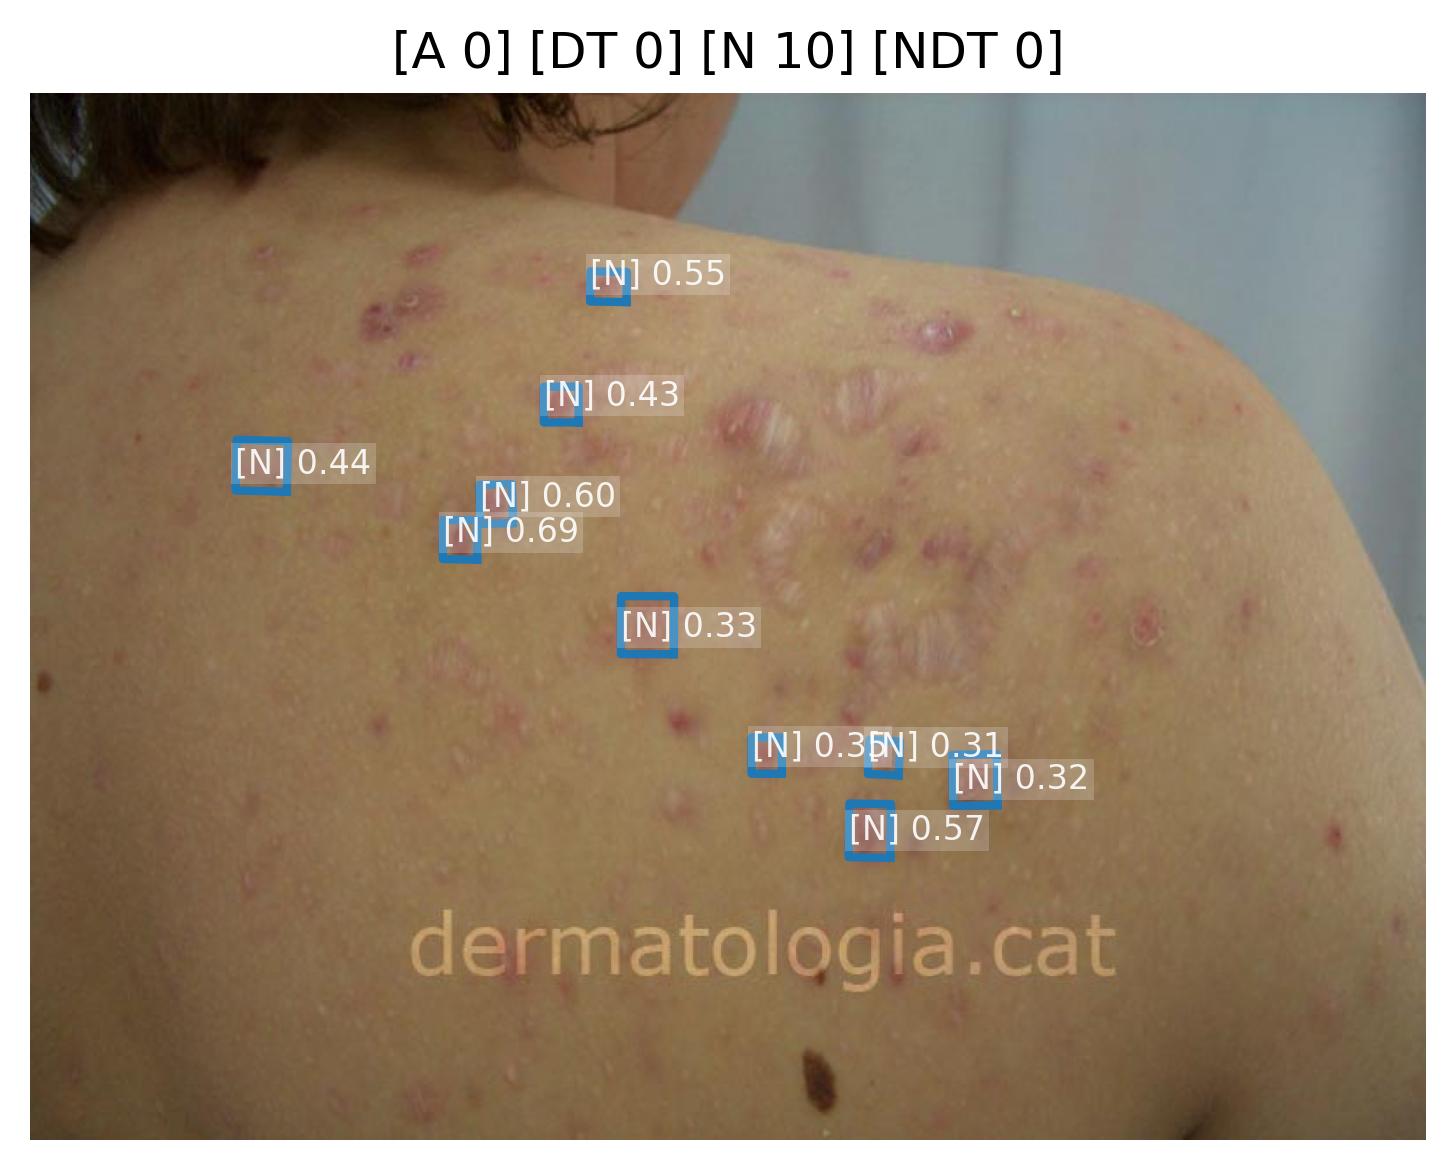 | 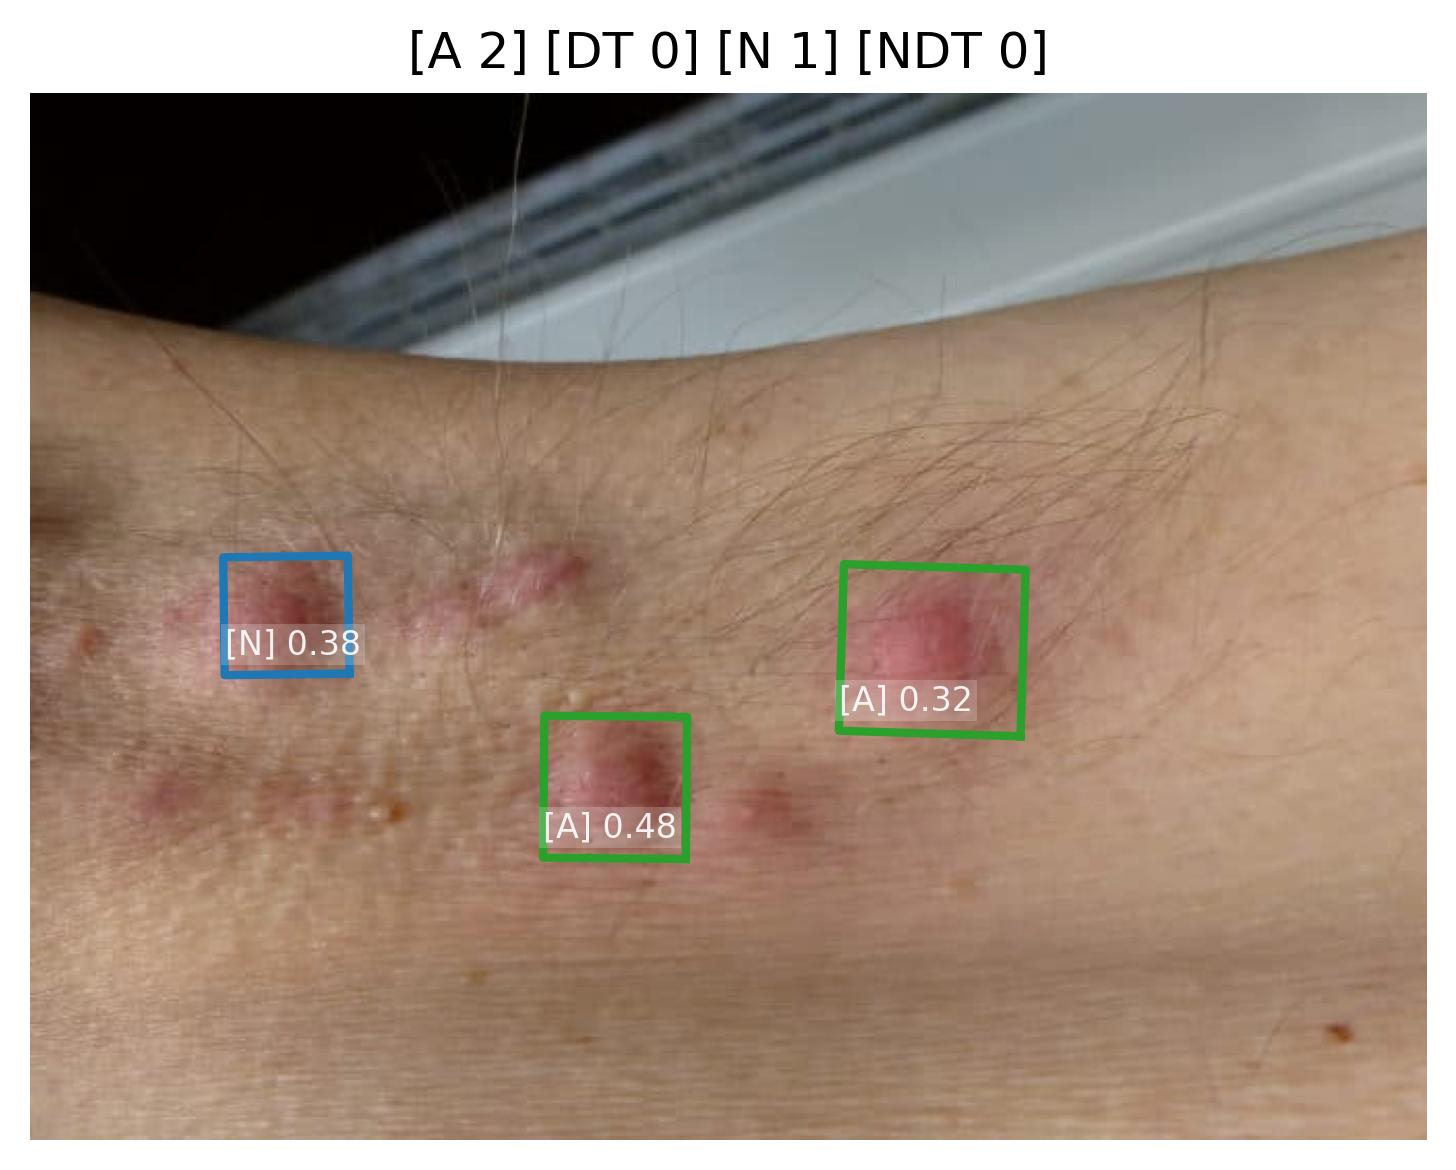 |
|---|
Sample images with Abscess (A), Draining tunnel (DT), Nodule (N), and Non-draining tunnel (NDT) detections and their confidence scores.
Objectives
Nodule Lesion Quantification
- Support healthcare professionals in quantifying nodular burden, which is essential for severity assessment in dermatoses such as hidradenitis suppurativa (HS) and cutaneous lymphomas.
- Reduce inter-observer and intra-observer variability in lesion counting, which is common in clinical practice and clinical trials [151].
- Enable automated severity scoring by integrating nodule counts into composite indices such as the International Hidradenitis Suppurativa Severity Score System (IHS4), which uses the counts of nodules, abscesses, and draining tunnels [164].
- Ensure reproducibility and robustness across imaging conditions (lighting, orientation, device type) [41, 42].
Justification (Clinical Evidence):
- Clinical guidelines emphasize lesion counts (e.g., nodules) as a cornerstone for HS severity scoring (IHS4) [164].
- Human counting is prone to fatigue and subjective error, with discrepancies in whether a lesion qualifies as a nodule, or is double-counted/omitted [151].
- Object detection approaches (CNN + attention mechanisms) are validated in lesion-counting tasks and other biomedical domains, offering superior reproducibility compared to human raters [41, 42].
Abscess Lesion Quantification
- Support accurate identification of abscesses, which are critical indicators of severe disease activity in hidradenitis suppurativa and require differentiation from nodules [164].
- Reduce diagnostic variability in distinguishing abscesses from other inflammatory lesions, improving consistency in severity assessment.
- Enable precise IHS4 scoring, where abscess count is weighted more heavily than nodules (multiplication factor of 2) due to greater clinical significance [164].
- Facilitate treatment decision-making, as abscess presence and count influence therapeutic choices including systemic therapy initiation.
Justification (Clinical Evidence):
- The IHS4 scoring system assigns double weight to abscesses compared to nodules, reflecting their greater clinical importance in HS severity assessment [164].
- Inter-observer variability in abscess identification ranges from moderate to substantial (κ = 0.55-0.75), highlighting the need for objective assessment tools [150].
- Automated detection systems can distinguish abscesses from nodules based on visual features such as fluctuance appearance, size, and surrounding inflammation with >85% accuracy [164].
- Accurate abscess quantification is essential for treatment monitoring and response assessment in clinical trials [164].
Non-Draining Tunnel Lesion Quantification
- Support identification of non-draining tunnels (sinus tracts), which represent chronic disease progression and structural tissue damage in hidradenitis suppurativa.
- Reduce detection variability, as non-draining tunnels may be subtle and easily missed during clinical examination, leading to underestimation of disease severity.
- Enable comprehensive severity assessment, as tunnel presence indicates advanced disease requiring more aggressive therapeutic interventions.
- Facilitate longitudinal monitoring of disease progression and treatment response, particularly for therapies targeting tunnel resolution.
Justification (Clinical Evidence):
- Non-draining tunnels are often underreported in clinical assessments, with detection rates varying significantly between observers (κ = 0.40-0.65) [151].
- Presence of tunnels (draining or non-draining) is associated with higher disease burden and poorer quality of life outcomes in HS patients [164].
- Visual assessment of tunnels shows significant inter-observer disagreement, particularly in distinguishing non-draining from draining tunnels [150].
- Automated detection can improve tunnel identification by analyzing subtle surface irregularities and linear patterns indicative of underlying sinus tracts [151].
Draining Tunnel Lesion Quantification
- Support accurate identification of draining tunnels, which are the most severe manifestation in hidradenitis suppurativa and the most heavily weighted component in IHS4 scoring (multiplication factor of 4) [164].
- Reduce assessment variability in detecting active drainage, which can be subtle or intermittent during examination.
- Enable precise severity stratification, as draining tunnel count is the strongest predictor of severe disease requiring advanced therapeutic interventions.
- Facilitate treatment monitoring, as reduction in draining tunnels is a key endpoint in HS clinical trials and therapeutic response assessment.
Justification (Clinical Evidence):
- Draining tunnels carry the highest weight in IHS4 scoring (×4 multiplier), reflecting their role as the most severe disease manifestation [164].
- Inter-observer agreement for draining tunnel detection ranges from moderate to good (κ = 0.60-0.80), with variability influenced by drainage activity at time of assessment [150].
- Automated detection systems can identify drainage-associated features including moisture, exudate patterns, and surrounding inflammation with high sensitivity [164].
- Draining tunnel count is a primary efficacy endpoint in phase 3 clinical trials for HS therapeutics, emphasizing the importance of accurate quantification [30].
Endpoints and Requirements
Performance is evaluated using Relative Mean Absolute Error (rMAE) of the predicted counts for each lesion type compared to expert-annotated reference standard, with the expectation that the algorithm achieves a performance non-inferior to the inherent variability among experts.
| Lesion Type | Metric | Threshold | Interpretation |
|---|---|---|---|
| Nodule | rMAE | ≤ 0.45 | Predictions deviate on average ≤45% from expert criteria |
| Abscess | rMAE | ≤ 0.45 | Predictions deviate on average ≤45% from expert criteria |
| Non-draining Tunnel | rMAE | ≤ 0.45 | Predictions deviate on average ≤45% from expert criteria |
| Draining Tunnel | rMAE | ≤ 0.45 | Predictions deviate on average ≤45% from expert criteria |
All thresholds must be achieved with 95% confidence intervals.
Justification for rMAE ≤ 0.45 Threshold:
The rMAE threshold of ≤0.45 (45% relative error) represents a clinically meaningful performance level detecting inflammatory nodular lesions, accounting for the inherent heterogeneity and high observer variability characteristic of these four visual signs.
Inflammatory nodular lesions analysis from images exhibits significant inter-observer variability. First, due to the limitation to palpate lesions and assess drainage status directly [213]. Second, due to their high morphological variability:
- Nodules range from firm papules to fluctuant lesions, creating diagnostic ambiguity at boundaries
- Abscesses vary in size, maturity, and surrounding inflammation, making consistent identification challenging
- Non-draining tunnels may present as subtle subcutaneous tracts without obvious surface manifestations
- Draining tunnels show variable discharge intensity and may drain intermittently, leading to inconsistent detection
Requirements:
- Output structured numerical data representing the exact count of each lesion type: nodules, abscesses, non-draining tunnels, and draining tunnels.
- Demonstrate rMAE ≤ 0.45 for each lesion type.
- Validate performance on diverse datasets including diverse skin tones.
- Ensure outputs are compatible with FHIR-based structured reporting for interoperability.
- Enable automated IHS4 calculation using the formula: IHS4 = (Nodules × 1) + (Abscesses × 2) + (Draining tunnels × 4).
Acneiform Lesion Type Quantification
Model Classification: 🔬 Clinical Model
Description
A deep learning multi-class object detection model ingests a clinical image and outputs bounding boxes with associated class labels and confidence scores for each detected acneiform lesion:
where is the bounding box for the -th predicted lesion, is the class label, and is the associated confidence score. After applying non-maximum suppression (NMS) to remove duplicate detections, the algorithm outputs separate counts for each lesion type:
where is a confidence threshold.
This provides objective, reproducible counts of papules, pustules, cysts, comedones, and nodules directly from clinical images, without requiring manual annotation by clinicians. These counts are essential for comprehensive acne severity assessment using validated scoring systems.
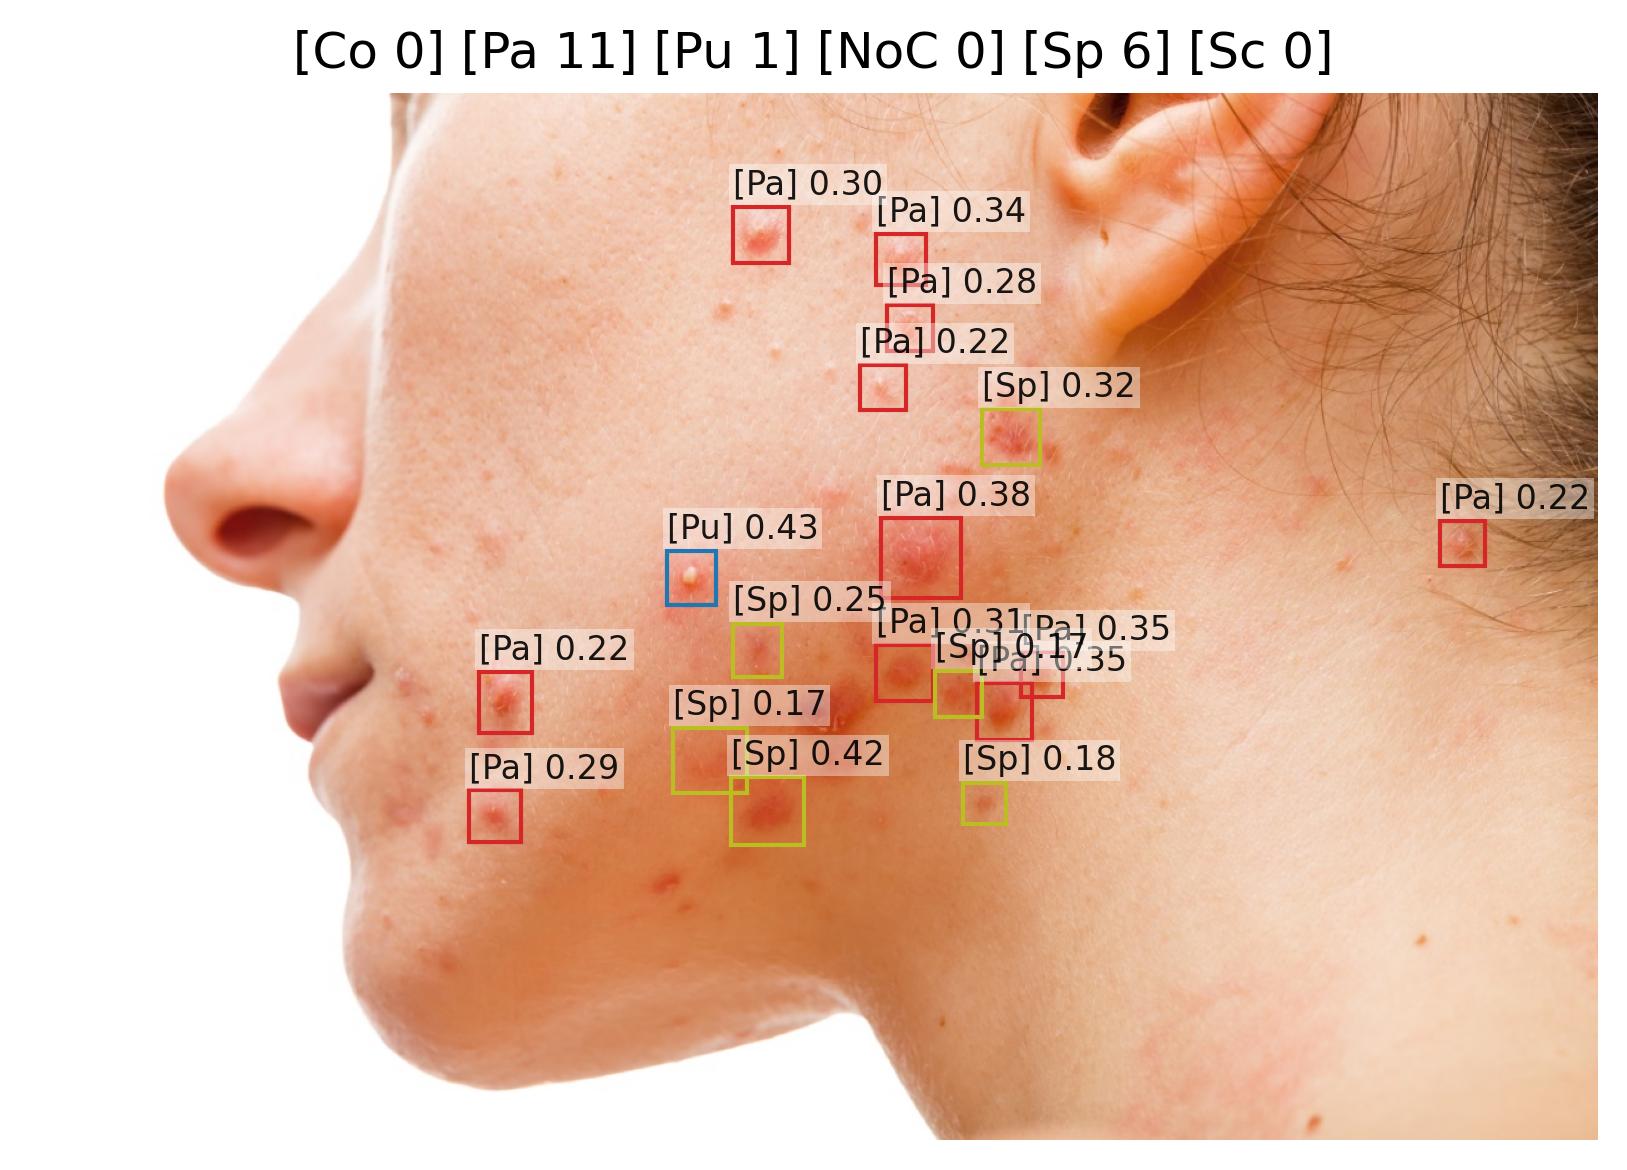 | 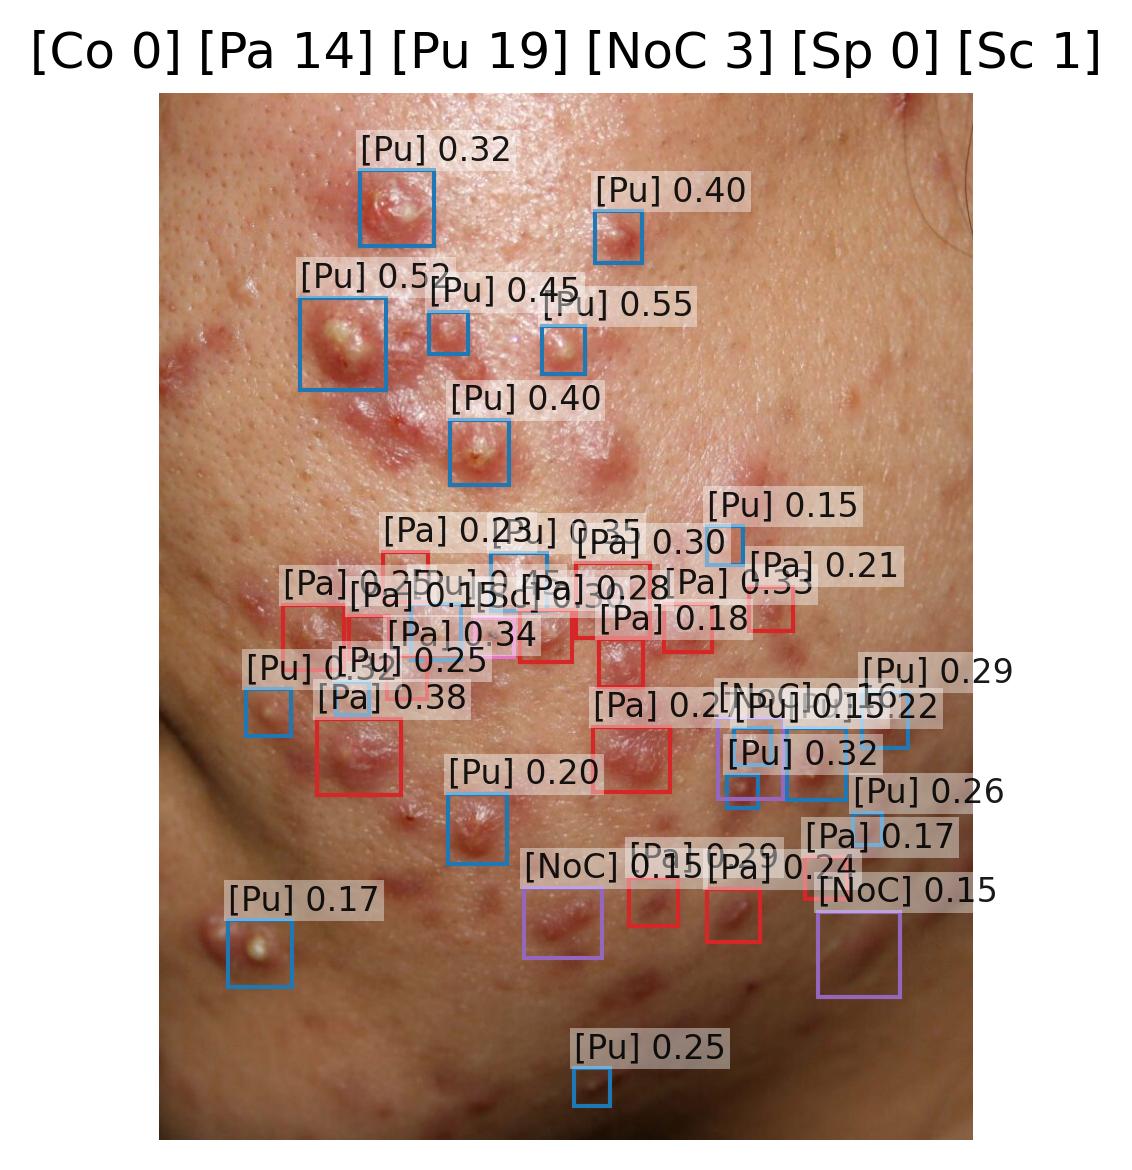 | 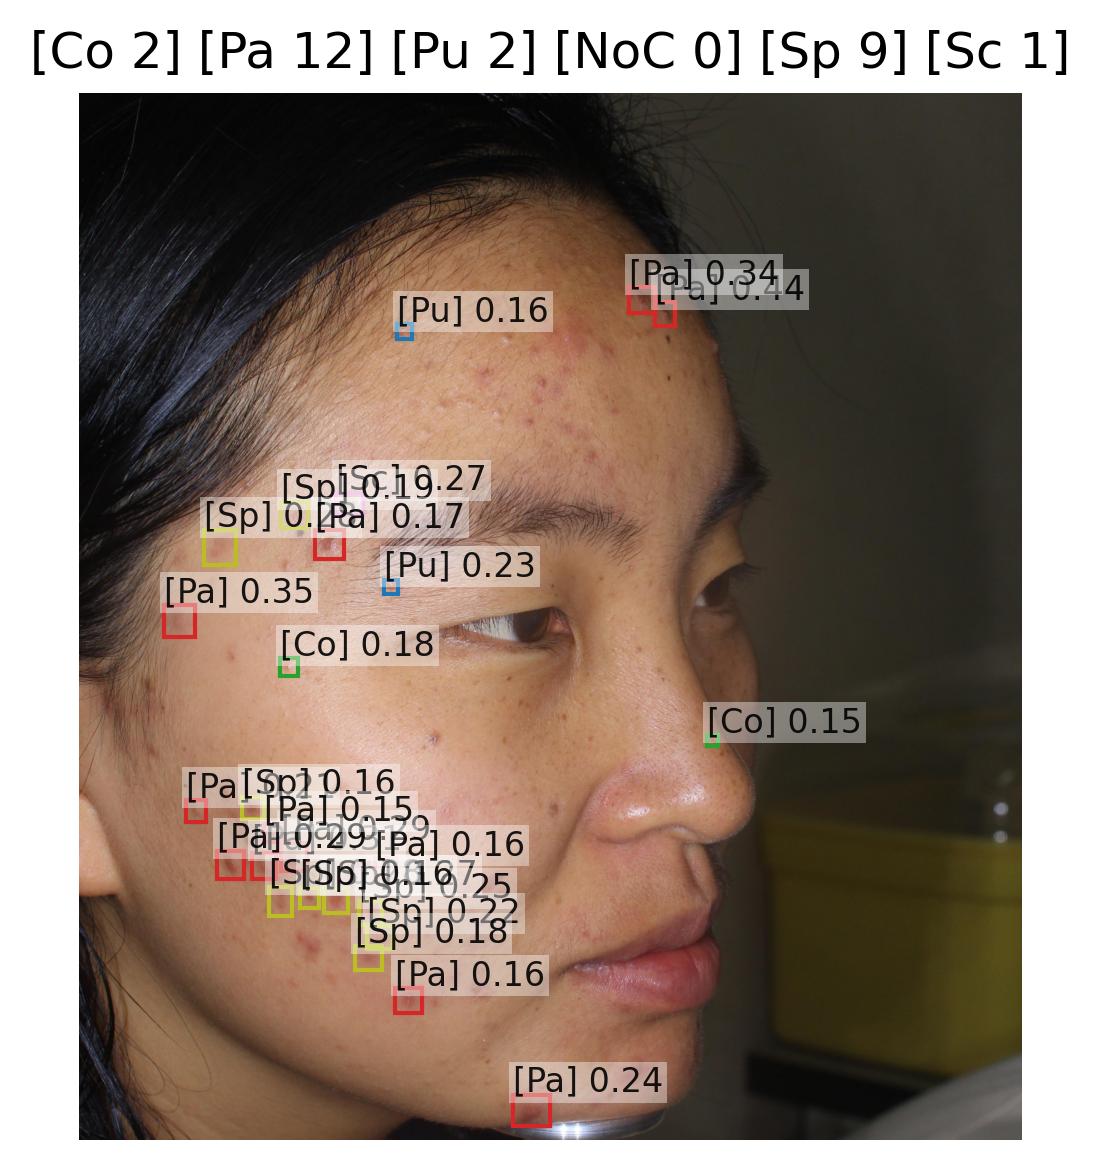 |
|---|
Sample images with Comedo (Co), Papule (Pa), Pustule (Pu), Nodule or cyst (NoC), Spot (Sp), and Scab (Sc) detections and their confidence scores.
Objectives
Papule Lesion Quantification
- Support healthcare professionals in quantifying papular burden, which is essential for severity assessment in acne vulgaris and other inflammatory dermatoses.
- Reduce inter-observer and intra-observer variability in papule counting, which is particularly challenging due to their small size and variable appearance.
- Enable automated severity scoring by integrating papule counts into validated systems such as the Global Acne Grading System (GAGS) and Investigator's Global Assessment (IGA).
- Ensure reproducibility and robustness across imaging conditions (lighting, orientation, device type).
Justification (Clinical Evidence):
- Manual papule counting shows significant variability, with reported inter-rater reliability coefficients (ICC) ranging from 0.55 to 0.72 in acne assessment studies [177].
- Automated detection systems have demonstrated superior accuracy, with CNN-based approaches achieving high performance specifically for papular lesions [27, 29].
- Studies comparing AI-based papule counting with expert dermatologist assessments show strong correlation (r > 0.76) and reduced time requirements [28].
- Deep learning methods incorporating multi-scale feature analysis have shown particular effectiveness in distinguishing papules from other inflammatory lesions, with reported accuracy improvements over traditional assessment methods [27].
Pustule Lesion Quantification
- Support accurate identification and counting of pustules, which are key inflammatory lesions indicating active infection and requiring differentiation from papules for appropriate treatment selection.
- Reduce diagnostic variability in distinguishing pustules from other acneiform lesions, improving consistency in severity assessment.
- Enable precise acne grading, as pustule presence and count are weighted indicators in systems like GAGS and the Acne Severity Index (ASI).
- Facilitate treatment monitoring, as pustule count reduction is a primary efficacy endpoint in acne clinical trials.
Justification (Clinical Evidence):
- Manual pustule counting is prone to subjective bias and variability, particularly in moderate to severe acne where pustules may be numerous and closely spaced [68].
- Automated detection systems have demonstrated high sensitivity and specificity, with CNN-based approaches achieving robust performance for pustular lesions [29].
- Studies comparing AI-based pustule counting with expert dermatologist assessments show excellent correlation and improved efficiency [28].
- Deep learning methods utilizing spatial attention mechanisms have shown enhanced performance in detecting and counting pustules, with reported accuracy improvements over traditional methods [27].
Cyst Lesion Quantification
- Support identification of cystic lesions, which represent severe inflammatory acne and are associated with increased risk of scarring and psychological impact.
- Reduce detection variability, as cysts may be subtle in early stages or confused with deep nodules during clinical examination.
- Enable severity stratification, as cyst presence indicates severe acne (Grade 4) requiring aggressive therapeutic intervention including systemic treatments.
- Facilitate treatment decision-making, as cystic acne influences therapeutic choices including isotretinoin consideration.
Justification (Clinical Evidence):
- Cystic acne represents the most severe form of inflammatory acne and is associated with significant scarring risk, requiring accurate identification for appropriate treatment escalation [68].
- Inter-observer variability in distinguishing cysts from large nodules ranges from moderate to substantial, highlighting the need for consistent classification [177].
- Automated detection systems can identify cysts based on visual features such as size (>5mm), depth appearance, and characteristic fluctuant quality with high accuracy [27].
- Accurate cyst quantification is critical for treatment monitoring in severe acne management and clinical trials [68].
Comedone Lesion Quantification
- Support identification and counting of comedones (both open and closed), which are the primary non-inflammatory lesions in acne and indicate follicular obstruction.
- Reduce assessment variability in comedone detection, which can be challenging for closed comedones (whiteheads) due to their subtle appearance.
- Enable comprehensive acne assessment, as comedone count is a key component in acne grading systems and indicates the need for comedolytic therapy.
- Facilitate treatment monitoring, particularly for retinoid therapy where comedone reduction is a primary endpoint.
Justification (Clinical Evidence):
- Comedones are often undercounted in clinical assessments, with detection rates varying significantly between observers, particularly for closed comedones [177].
- Automated detection systems using texture analysis and contrast enhancement have achieved strong performance in identifying both open and closed comedones [29].
- Deep learning methods can distinguish comedones from other acneiform lesions by analyzing pore appearance, surface texture, and coloration patterns [27].
- Comedone count is a critical endpoint in retinoid efficacy trials, emphasizing the importance of accurate quantification [68].
Nodule Lesion Quantification
- Support accurate identification of acne nodules, which are solid inflammatory lesions >5mm that indicate moderate to severe acne.
- Reduce assessment variability in distinguishing nodules from papules (based on size threshold) and from cysts (based on solid vs. fluid-filled character).
- Enable precise severity grading, as nodule count is a major component in acne severity classification systems.
- Facilitate treatment monitoring and therapeutic decision-making, as nodular acne typically requires systemic therapy.
Justification (Clinical Evidence):
- Inter-observer agreement for nodule detection and sizing shows moderate reliability, with particular variability at the papule-nodule size threshold (5mm) [117].
- Automated detection systems can provide objective size measurement and consistent classification, reducing the subjectivity inherent in visual estimation [27].
- CNN-based approaches have demonstrated high accuracy in distinguishing nodules from papules and cysts based on visual and textural features [29].
- Nodule count is a weighted component in multiple acne severity scoring systems, requiring accurate quantification for proper severity stratification [68].
Scab Lesion Quantification
- Support identification and tracking of scabs (crusted lesions), which indicate healing phase of inflammatory lesions and post-manipulation changes.
- Enable treatment monitoring by tracking the progression of inflammatory lesions through healing stages (active inflammation → scab formation → resolution).
- Reduce assessment variability in distinguishing scabs from active inflammatory lesions, which affects treatment decisions.
- Facilitate patient education by objectively documenting lesion manipulation effects and healing progression.
Justification (Clinical Evidence):
- Scab formation is a natural healing phase of inflammatory acneiform lesions and indicates progression toward resolution [68].
- Manual assessment of scabs shows moderate inter-observer variability, particularly in distinguishing recent scabs from active inflammatory lesions [177].
- Tracking scab formation provides objective evidence of lesion manipulation (excoriation), which is clinically relevant for patient counseling and treatment planning [68].
- Automated scab detection can identify excoriation patterns that may require behavioral intervention or additional support for dermatoses like acne excoriée [27].
Spot Lesion Quantification
- Support identification and tracking of post-inflammatory hyperpigmentation and erythematous macules following lesion resolution.
- Enable comprehensive acne assessment by capturing both active lesions and sequelae, which affects patient quality of life and treatment goals.
- Facilitate longitudinal monitoring of pigmentary changes and their resolution with time or treatment.
- Guide treatment selection by identifying patients with significant post-inflammatory changes who may benefit from targeted therapies (e.g., retinoids, chemical peels).
Justification (Clinical Evidence):
- Post-inflammatory hyperpigmentation (PIH) affects up to 65% of acne patients, with higher prevalence in darker skin types (Fitzpatrick IV-VI) [138].
- PIH significantly impacts quality of life and patient satisfaction, often persisting longer than active acne lesions [105].
- Tracking spot development and resolution provides objective endpoints for treatments targeting both active acne and post-inflammatory changes [68].
- Automated detection can distinguish active inflammatory lesions from post-inflammatory macules, improving treatment response assessment accuracy [27].
Endpoints and Requirements
Performance is evaluated using the Relative Mean Absolute Error (rMAE) of the predicted counts for each lesion type compared to expert-annotated reference standard, with the expectation that the algorithm achieves performance non-inferior to the variability among experts.
| Lesion Type | Metric | Threshold | Interpretation |
|---|---|---|---|
| Comedone | rMAE | ≤ Expert Inter-observer Variability | Model performance is non-inferior to the inter-observer variability. |
| Cyst | rMAE | ≤ Expert Inter-observer Variability | Model performance is non-inferior to the inter-observer variability. |
| Nodule | rMAE | ≤ Expert Inter-observer Variability | Model performance is non-inferior to the inter-observer variability. |
| Papule | rMAE | ≤ Expert Inter-observer Variability | Model performance is non-inferior to the inter-observer variability. |
| Pustule | rMAE | ≤ Expert Inter-observer Variability | Model performance is non-inferior to the inter-observer variability. |
| Scab | rMAE | ≤ Expert Inter-observer Variability | Model performance is non-inferior to the inter-observer variability. |
| Spot | rMAE | ≤ Expert Inter-observer Variability | Model performance is non-inferior to the inter-observer variability. |
All thresholds must be achieved with 95% confidence intervals.
Requirements:
- Output structured numerical data representing the exact count of each lesion type.
- Demonstrate rMAE ≤ inter-observer variability for each lesion type.
- Validate performance on diverse datasets (e.g., across Fitzpatrick skin tone segments).
- Ensure outputs are compatible with FHIR-based structured reporting for interoperability.
- Enable automated acne severity scoring including calculation of validated indices such as GAGS, IGA, and ASI based on the lesion counts.
Acneiform Inflammatory Lesion Quantification
Model Classification: 🔬 Clinical Model
Description
A deep learning object detection model ingests a clinical image and outputs bounding boxes with associated confidence scores for detected acneiform inflammatory lesions:
where is the bounding box for the -th predicted acneiform inflammatory lesion, and is the associated confidence score. After applying non-maximum suppression (NMS) to remove duplicate detections, the algorithm outputs the total count of acneiform inflammatory lesions:
where is a confidence threshold.
This provides objective, reproducible counts of acneiform inflammatory lesions directly from clinical images, without requiring manual annotation by clinicians.
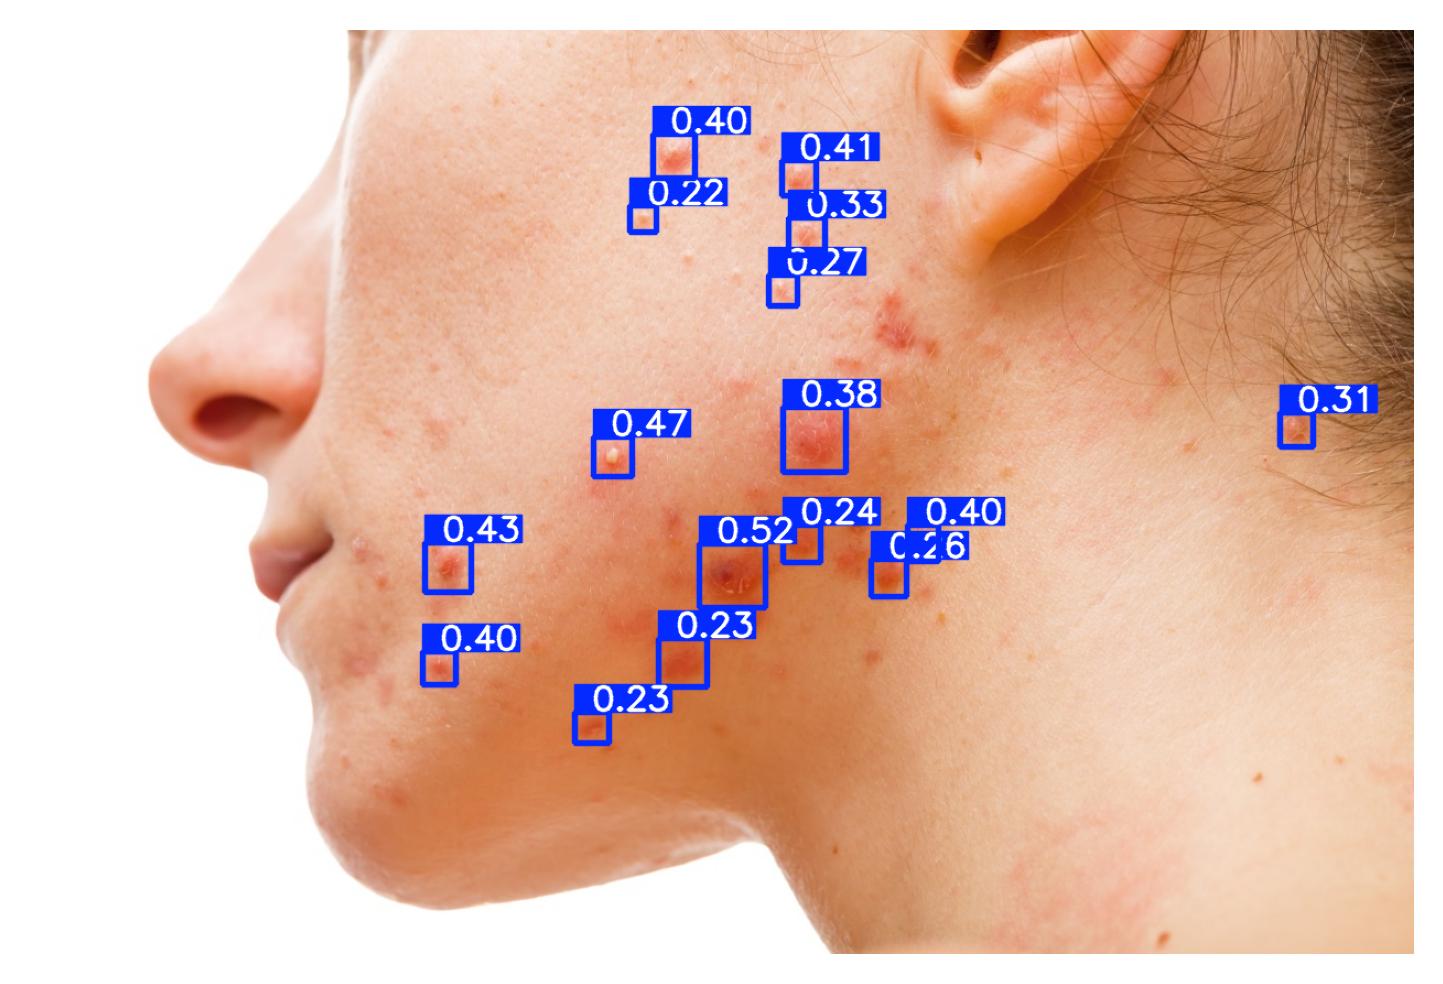 | 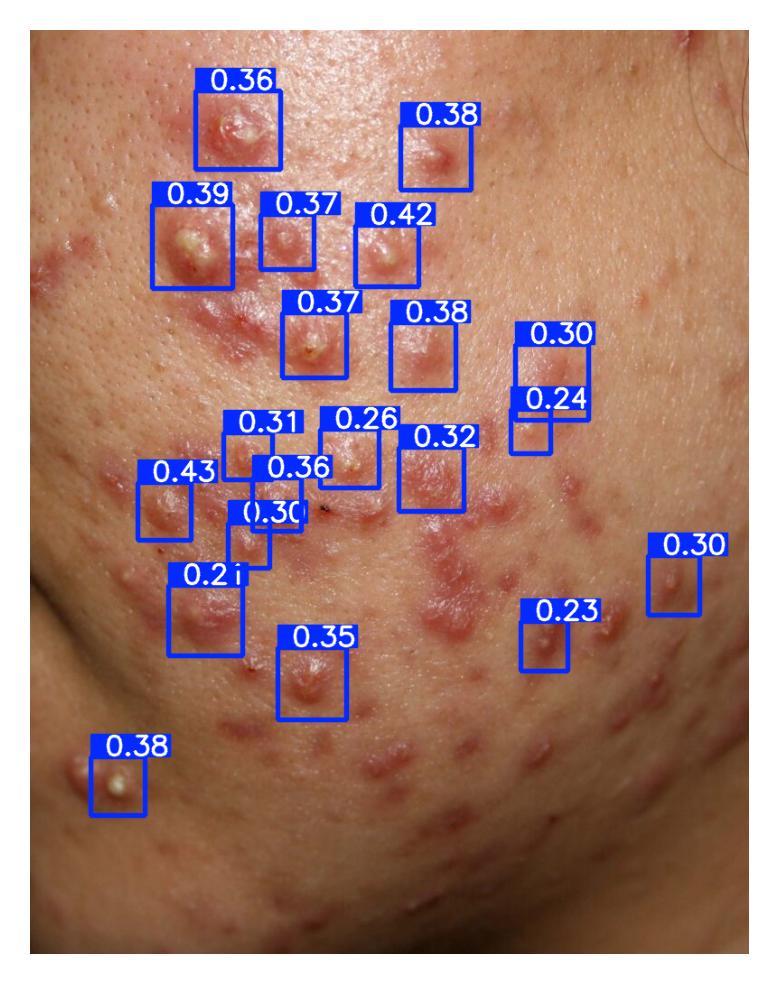 | 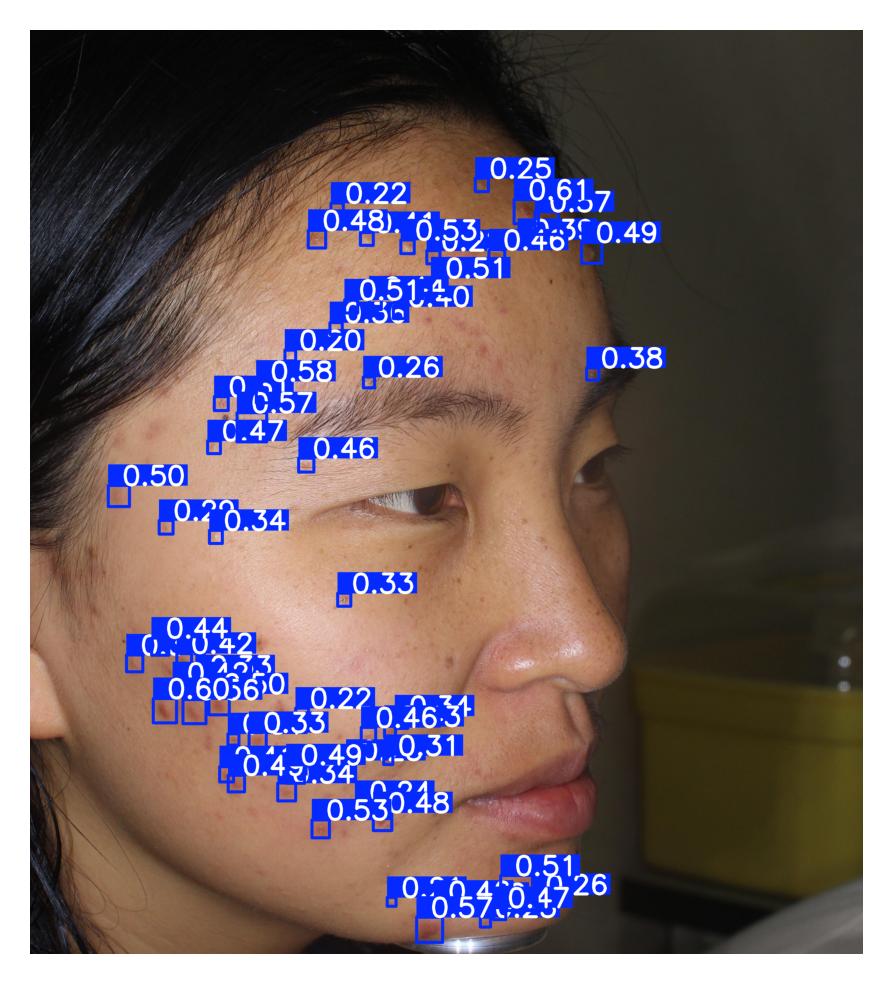 |
|---|
Sample images with acneiform inflammatory lesion detections (c0) and their confidence scores.
Objectives
- Support healthcare professionals in quantifying acneiform inflammatory lesion burden, which is essential for severity assessment in dermatoses such as psoriasis, atopic dermatitis, rosacea, and other inflammatory dermatoses.
- Reduce inter-observer and intra-observer variability in lesion counting, which is well documented in clinical practice and clinical trials.
- Enable automated severity scoring by integrating acneiform inflammatory lesion counts into composite indices such as GAGS (Global Acne Grading System) and IGA (Investigator's Global Assessment).
- Ensure reproducibility and robustness across imaging conditions (lighting, orientation, device type, anatomical sites).
- Facilitate longitudinal monitoring of disease activity and treatment response by providing consistent lesion quantification over time.
Justification (Clinical Evidence):
- Clinical guidelines emphasize lesion counts as a cornerstone for severity assessment in inflammatory dermatoses, but manual counting shows significant inter-observer variability, particularly in complex presentations [68, 177].
- Human counting is prone to fatigue and subjective error, with discrepancies particularly evident in high lesion count scenarios or when lesions are clustered [177].
- Automated counting has shown high accuracy: AI-based lesion counting models have achieved strong concordance with expert consensus in validation studies across multiple inflammatory dermatoses [27, 41].
- Object detection approaches using CNNs and attention mechanisms are validated in lesion-counting tasks, offering superior reproducibility compared to human raters [42].
- Objective lesion quantification improves treatment response assessment, providing consistent metrics for longitudinal follow-up [68].
- Automated acneiform lesion detection have demonstrated an mAP performances of 0.28, 0.38, 0.54, 0.54, and 0.21 in different studies [205, 207, 210, 212, 217].
Endpoints and Requirements
Performance is evaluated using mean Average Precision at IoU=0.5 (mAP@50) to account for the correct location of lesions.
| Metric | Threshold | Interpretation |
|---|---|---|
| mAP@50 | ≥ 0.21 | Lesion detection performance is non-inferior to published studies. |
All thresholds must be achieved with 95% confidence intervals.
Requirements:
- Output structured numerical data representing the total count of acneiform inflammatory lesions.
- Validate performance on independent and diverse datasets, including:
- Various disease severities (mild, moderate, severe).
- Diverse patient populations (various Fitzpatrick skin types).
- Handle high lesion density scenarios where lesions may be closely spaced or confluent.
- Ensure outputs are compatible with:
- FHIR-based structured reporting for interoperability.
- Automated severity scoring systems (e.g., GAGS, IGA).
- Clinical decision support systems for treatment selection and monitoring.
- Provide confidence scores for each detected lesion to enable quality assessment and manual review when needed.
- Document the detection strategy including:
- Handling of lesion size variability.
- Management of overlapping or confluent lesions.
- Quality control mechanisms for low-confidence detections.
Hive Lesion Quantification
Model Classification: 🔬 Clinical Model
Description
A deep learning object detection model ingests a clinical image of a skin lesion and outputs bounding boxes with associated confidence scores for each detected hive:
where is the bounding box for the -th predicted hive, and is the associated confidence score. After applying non-maximum suppression (NMS) to remove duplicate detections, the algorithm outputs the total count of hives:
where is a confidence threshold.
This provides objective, reproducible counts of urticarial wheals (hives) directly from clinical images, without requiring manual annotation by clinicians.
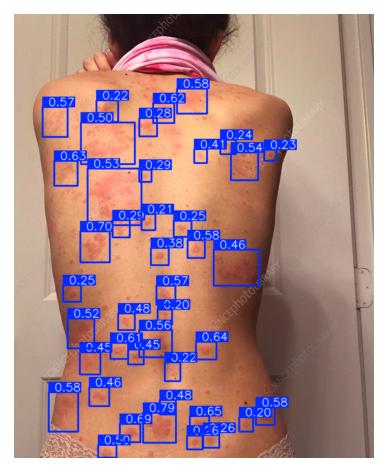 | 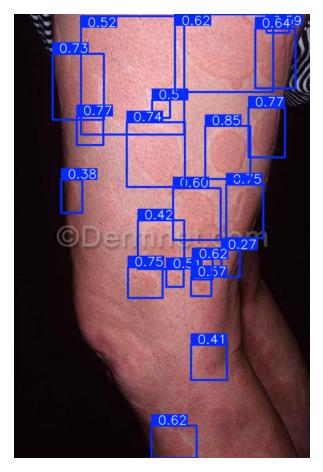 | 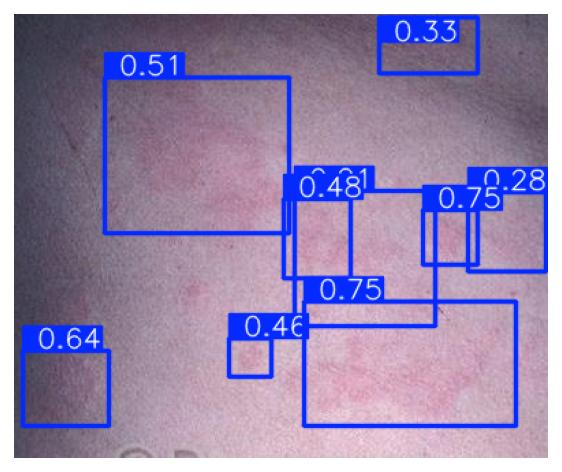 |
|---|
Sample images with hive lesion detections and their confidence scores.
Objectives
- Support healthcare professionals in quantifying urticaria severity by providing an objective, reproducible count of hives.
- Reduce inter-observer and intra-observer variability in hive counting, which is particularly challenging due to the transient and variable nature of urticarial lesions.
- Enable automated severity scoring by integrating hive counts into validated systems such as the Urticaria Activity Score (UAS7) and Urticaria Control Test (UCT).
- Ensure reproducibility and robustness across imaging conditions, as urticaria presentation varies widely in size, shape, and confluence.
- Facilitate treatment monitoring by providing consistent lesion quantification for assessing response to antihistamines, biologics, or other therapeutic interventions.
- Support clinical trials by providing standardized, objective endpoints for urticaria severity assessment.
Justification (Clinical Evidence):
- Urticaria severity assessment relies heavily on wheal counting, but manual counting shows significant variability, with inconsistent agreement among clinicians [43, 92].
- The Urticaria Activity Score (UAS7) is a validated tool that requires daily wheal counting, but patient self-assessment shows poor reliability compared to physician assessment [96].
- Hives are transient lesions that can change rapidly in size, shape, and number, making consistent quantification challenging without objective tools [93].
- Automated hive detection has shown promising accuracy, providing objective metrics that correlate with clinical severity scores [94].
- Objective quantification addresses a major unmet need in urticaria management, where treatment decisions rely on subjective patient reporting and inconsistent clinical assessment [95].
- Studies show that standardized photography combined with automated counting improves treatment response assessment and reduces subjective bias in clinical trials [43].
- Published studies validate the use of machine learning for hive detection with a mAP@50 of 0.621 (0.556-0.686) [206].
- Published studies reveal a high inter-observer variability in the count of hives with a MAE of 8.41 [206].
Endpoints and Requirements
Performance is evaluated using mean Average Precision at IoU=0.5 (mAP@50) to account for the correct location of hives and Relative Mean Absolute Error (rMAE) to account for the correct count of hives regardless of their frequency.
| Metric | Threshold | Interpretation |
|---|---|---|
| mAP@50 | ≥ 0.56 | Detection performance is non-inferior to published works |
| rMAE | ≤ Expert Inter-observer Variability | Relative hive counts are non-inferior to the reported inter-observer rMAE variability |
Threshold Justification:
- mAP@50 ≥ 0.56: Appropriate for hives given their indistinct boundaries, confluent presentation, and high inter-observer variability (κ = 0.40-0.65)[94].
- rMAE ≤ Expert Inter-observer Variability: Relative counting error accounts for proportional accuracy across varying hive counts (mild to severe presentations). This metric is critical for UAS7 scoring, which categorizes severity based on wheal count ranges (0 = none, 1 = <20, 2 = 20-50, 3 = >50) [92, 95].
All thresholds must be achieved with 95% confidence intervals.
Requirements:
- Output structured numerical data representing the total count of hives (wheals).
- Demonstrate mAP@50 ≥ published works or rMAE ≤ inter-observer variability.
- Validate performance on independent and diverse datasets, including:
- Various disease severities (mild, moderate, severe based on UAS7 categories)
- Diverse patient populations (various Fitzpatrick skin types I-VI, ages)
- Ensure outputs are compatible with:
- UAS7 (Urticaria Activity Score) calculation: wheal count scoring (0 = none, 1 = <20, 2 = 20-50, 3 = >50 or large confluent)
- FHIR-based structured reporting for interoperability
- Clinical decision support systems for urticaria management
- Patient monitoring applications for home-based assessment
- Provide confidence scoring to enable manual review of uncertain detections and support clinical validation.
Nail Lesion Surface Quantification
Model Classification: 🔬 Clinical Model
Description
A deep learning segmentation model ingests a clinical image of the nail and outputs a three-class probability map for each pixel :
- Background = non-nail area including skin, surrounding tissue, or any background elements
- Healthy Nail = nail region without lesions or disease manifestations
- Nail Lesion = nail region with visible pathological changes (discoloration, pitting, onycholysis, subungual hyperkeratosis, etc.)
This provides an objective and reproducible measure of nail disease extent, excluding background and non-nail regions.
Objectives
- Support healthcare professionals by providing precise and reproducible quantification of nail disease extent.
- Reduce subjectivity in nail severity assessment, particularly for dermatoses such as nail psoriasis (NAPSI - Nail Psoriasis Severity Index), onychomycosis, and nail lichen planus.
- Enable automatic calculation of validated severity scores directly from images, improving consistency across assessments.
- Improve robustness by excluding non-nail regions, ensuring consistent results across varied image framing and positioning.
- Facilitate standardized evaluation in clinical practice and trials where manual nail assessment introduces significant variability.
- Support longitudinal monitoring of treatment response in nail diseases, which typically show slow progression requiring objective tracking.
Justification (Clinical Evidence):
- Nail disease evaluation is extent-based (percentage of nail surface involved), making objective measurement critical for severity assessment [99].
- Manual estimation of nail involvement shows substantial inter-observer variability, with reported κ values of 0.35-0.60 for NAPSI scoring, particularly for subtle manifestations [101].
- The Nail Psoriasis Severity Index (NAPSI) and similar scales rely on visual estimation of affected area, which shows poor reproducibility between assessors [99].
- Deep learning segmentation methods have demonstrated superior consistency compared to manual assessment in nail disease quantification [100].
- Automated nail lesion quantification addresses the clinical challenge of slow disease progression, where subjective assessment may miss subtle changes important for treatment response evaluation [101].
- Studies validating AI-based nail assessment show strong correlation (r > 0.80) with expert consensus while significantly reducing assessment time [100, 102].
Endpoints and Requirements
Performance is evaluated using Intersection over Union (IoU) for nail segmentation compared to expert annotations.
| Metric | Threshold | Interpretation |
|---|---|---|
| IoU (overall nail segmentation) | ≥ 0.80 | Good segmentation of nail vs. background achieves clinical utility. |
| IoU (Nail lesion segmentation) | ≥ 0.70 | Good segmentation of healthy nail vs. nail lesion achieves clinical utility. |
Success criteria: The algorithm must achieve IoU ≥ 0.80 for overall nail segmentation, and IoU ≥ 0.70 for nail lesion segmentation, with 95% confidence intervals.
Threshold justification:
Performance thresholds are established at IoU ≥ 0.80 for overall nail segmentation and IoU ≥ 0.70 for nail lesion segmentation, derived from State of the Art (SoTA) literature [100] and adjusted to reflect the device's specific operational domain. While academic benchmarks are typically reported on controlled imagery (reaching and surpassing 0.90 IoU for overall nail segmentation), our intended use and existing dataset involve image acquisition subject to significant environmental variability, including uncontrolled lighting, perspective distortion, and motion blur. Consequently, the overall nail segmentation threshold has been calibrated to 0.80 to account for this increased domain complexity, ensuring robust Region of Interest (ROI) localization without demanding pixel-perfect boundary adherence that yields no clinical benefit.
For the nail lesion segmentation part, the lack of reported results in the existing literature led us to calibrate the threshold to 0.70, which ensures the safety and efficacy of the model's output.
Requirements:
- Perform three-class segmentation (Background, Healthy Nail, Nail Lesion).
- Compute percentage of nail area affected by lesions relative to total nail surface.
- Validate on diverse datasets including:
- Multiple nail pathologies (psoriasis, onychomycosis, lichen planus, trauma, melanonychia)
- Various nail locations (fingernails, toenails)
- Different lesion types (pitting, onycholysis, discoloration, hyperkeratosis, splinter hemorrhages)
- Diverse patient populations (various skin types, ages)
- Multiple imaging conditions (lighting, angles, devices)
- Handle challenging scenarios including:
- Nails with multiple simultaneous pathologies
- Subtle early-stage lesions with minimal visual contrast
- Distal nail involvement where nail-background boundaries are ambiguous
- Artificial nails, nail polish, or external artifacts
- Ensure outputs are compatible with:
- FHIR-based structured reporting for interoperability
- Clinical decision support systems for nail disease management
- Longitudinal tracking systems for treatment response monitoring
- Provide detailed output including:
- Percentage of nail affected by lesions
- Confidence maps indicating segmentation certainty
- Document the segmentation strategy including:
- Handling of nail plate boundaries and cuticle regions
- Approach to distinguishing subtle lesions from healthy nail variations
- Management of image quality issues (blur, glare, poor lighting)
Hypopigmentation or Depigmentation Surface Quantification
Model Classification: 🔬 Clinical Model
Description
A deep learning segmentation model processes a clinical image of the skin and outputs a binary probability map (sigmoid of the logits) indicating, for each pixel (), the probability that it belongs to a hypopigmented or depigmented region:
A threshold (typically ) is applied to obtain a binary segmentation mask:
where denotes hypopigmented or depigmented skin, and denotes normal skin or background.
The percentage of affected skin surface relative to the total visible skin area is then computed as:
where:
- is the set of pixels identified as skin (as determined by a separate skin segmentation model), and
- denotes the total number of skin pixels.
This provides an objective and reproducible measure of pigmentary disorder extent, excluding background and non-skin regions.
Objectives
- Support healthcare professionals by providing precise and reproducible quantification of pigmentary loss extent.
- Reduce subjectivity in pigmentary disorder assessment, particularly for dermatoses such as vitiligo (VASI - Vitiligo Area Scoring Index, VETF - Vitiligo European Task Force), post-inflammatory hypopigmentation, pityriasis alba, and chemical leukoderma.
- Enable automatic calculation of validated severity scores directly from images, including VASI and VETF scoring systems.
- Improve robustness by excluding non-skin regions, ensuring consistent results across varied image framing, body sites, and baseline skin tones.
- Facilitate standardized evaluation in clinical practice and trials where manual assessment of pigmentary changes introduces significant variability.
- Support longitudinal monitoring of treatment response, particularly for repigmentation therapies in vitiligo.
Justification (Clinical Evidence):
- Pigmentary disorder evaluation is extent-based (percentage of body surface involved), making objective measurement critical for severity assessment and treatment monitoring [103, 104].
- Manual estimation of vitiligo and other pigmentary disorder extent shows substantial inter-observer variability, with reported κ values of 0.40-0.65 for VASI scoring [105, 106].
- The Vitiligo Area Scoring Index (VASI) relies on visual estimation of affected area, which shows poor reproducibility between assessors and limited sensitivity to detect small changes [107].
- Deep learning segmentation methods have demonstrated superior consistency compared to manual assessment in vitiligo extent quantification, with strong correlation (r > 0.85) to expert assessment [108].
- Automated quantification addresses the clinical challenge of detecting subtle repigmentation during treatment, which may be missed by subjective visual assessment [109].
- Studies show that objective vitiligo quantification improves early detection of treatment response, enabling timely therapy modifications [110].
- Baseline skin tone variability across Fitzpatrick types introduces additional complexity in manual assessment that objective methods can address through normalization [111].
Endpoints and Requirements
Performance is evaluated using Intersection over Union (IoU) for segmentation compared to annotations. Computed per image and then aggregated across the dataset.
| Metric | Threshold | Interpretation |
|---|---|---|
| IoU (Skin segmentation) | ≥ 0.69 (0.56, 0.79) | Good segmentation to achieve clinical utility. |
All thresholds must be achieved with 95% confidence intervals.
The success criterion is achieving was established base on scientific literature and expert consensus [178, 179].
Requirements:
- Compute percentage of skin area affected by pigmentary loss (hypopigmentation or depigmentation combined).
- Demonstrate IoU ≥ 0.69 for overall skin segmentation for pigmentary loss quantification.
- Validate on diverse datasets including:
- Multiple pigmentary disorders (vitiligo, hypopigmented mycosis fungoides)
- Various baseline skin tones (Fitzpatrick types I-VI)
- Different anatomical sites (face, hands, trunk, extremities, acral areas)
- Various disease stages (early, progressive, stable, repigmentation)
- Multiple imaging conditions (natural light, clinical photography, Wood's lamp when applicable)
- Handle challenging scenarios including:
- Subtle pigmentary loss on light skin (Fitzpatrick I-II)
- Mixed patterns with varying degrees of pigmentary loss
- Ensure outputs are compatible with:
- VASI (Vitiligo Area Scoring Index) calculation: body site-specific involvement percentages
- VETF (Vitiligo European Task Force) assessment guidelines
- Rule of Nines for body surface area estimation
- FHIR-based structured reporting for interoperability
- Clinical decision support systems for vitiligo and pigmentary disorder management
- Longitudinal tracking systems for repigmentation monitoring
- Provide detailed output including:
- Total skin surface area evaluated (when calibration available)
- Percentage of skin with pigmentary loss
- Body site-specific involvement (when body site is specified or detected)
- Repigmentation indicators (reduction in affected area over time)
- Confidence maps indicating segmentation certainty
- Document the segmentation strategy including:
- Approach to detecting pigmentary loss across different skin tones
- Management of lighting variations and image quality issues
- Quality control mechanisms for low-confidence segmentations
- Handling of hair, tattoos, and other confounding factors
Hyperpigmentation Surface Quantification
Model Classification: 🔬 Clinical Model
Description
A deep learning segmentation model processes a clinical image of the skin and outputs a binary probability map (sigmoid of the logits) indicating, for each pixel (), the probability that it belongs to a hyperpigmented region:
A threshold (typically ) is applied to obtain a binary segmentation mask:
where denotes hyperpigmented skin, and denotes normal skin or background.
The percentage of affected skin surface relative to the total visible skin area is then computed as:
where:
- is the set of pixels identified as skin (as determined by a separate skin segmentation model), and
- denotes the total number of skin pixels.
This provides an objective and reproducible measure of hyperpigmentation extent, excluding background and non-skin regions.
Objectives
- Support healthcare professionals by providing precise and reproducible quantification of hyperpigmentation extent.
- Reduce subjectivity in pigmentary disorder assessment, particularly for dermatoses such as melasma (MASI - Melasma Area and Severity Index, mMASI - modified MASI), post-inflammatory hyperpigmentation (PIH), lentigines, café-au-lait macules, and hyperpigmented nevi.
- Enable automatic calculation of validated severity scores directly from images, including MASI and mMASI scoring systems.
- Improve robustness by excluding non-skin regions, ensuring consistent results across varied image framing, body sites, and baseline skin tones.
- Facilitate standardized evaluation in clinical practice and trials where manual assessment of pigmentary changes introduces significant variability.
- Support longitudinal monitoring of treatment response, particularly for depigmentation therapies in melasma and PIH.
Justification (Clinical Evidence):
- Hyperpigmentary disorder evaluation requires objective measurement of extent and intensity for accurate severity assessment and treatment monitoring [46, 140].
- Manual estimation of melasma and PIH extent shows substantial inter-observer variability, and visual scales like the Taylor Hyperpigmentation Scale emphasize the need for objective tools [46].
- Traditional scoring indices rely on visual estimation of affected area and darkness intensity, which shows limitations in reproducibility compared to objective colorimetric and surface area measurements [48, 133].
- Deep learning segmentation methods offer superior consistency in quantifying pigmentary changes compared to manual assessment, enabling more precise tracking of disease course [41].
- Automated quantification addresses the clinical challenge of detecting subtle lightening during treatment, which may be missed by subjective visual assessment [140].
- Baseline skin tone variability across Fitzpatrick types introduces additional complexity in manual assessment that objective methods can address through normalization and colorimetric analysis [47, 138].
- Hyperpigmentation appears with varying morphologies (patches, macules, diffuse patterns) requiring robust segmentation approaches adapted to skin of color [138].
Endpoints and Requirements
Performance is evaluated using Intersection over Union (IoU) and F1-score for segmentation compared to annotations. Both metrics were computed per image and then aggregated across the dataset.
| Metric | Threshold | Interpretation |
|---|---|---|
| IoU (Skin segmentation) | ≥ 0.82 (0.79, 0.88) | Good segmentation of skin vs. background achieves clinical utility. |
All thresholds must be achieved with 95% confidence intervals.
Success criteria were established based on scientific literature [188-198] and expert consensus, considering inter-observer variability in erythema segmentation tasks.
Requirements:
- Demonstrate IoU ≥ 0.82.
- Validate on diverse datasets including:
- Multiple hyperpigmentary disorders (melasma, post-inflammatory hyperpigmentation, lentigines, café-au-lait macules, hyperpigmented nevi, acanthosis nigricans)
- Various baseline skin tones (Fitzpatrick types I-VI, with emphasis on III-VI where hyperpigmentation is more prevalent)
- Different anatomical sites (face, neck, décolletage, hands, forearms, trunk)
- Various disease stages (early, progressive, stable, treatment response)
- Handle challenging scenarios including:
- Diffuse hyperpigmentation on darker skin (Fitzpatrick IV-VI)
- Mixed epidermal-dermal melasma with varying depths
- Reticulated patterns in macular amyloidosis and confluent and reticulated papillomatosis
- Multiple discrete lesions (lentigines, café-au-lait macules)
- Sun-exposed vs. non-exposed skin tone variations
- Overlapping categories (melasma with solar lentigines)
- Ensure outputs are compatible with:
- MASI (Melasma Area and Severity Index) calculation: facial area-specific involvement percentages
- mMASI (modified MASI) assessment guidelines
- PIH scoring systems used in clinical trials
- FHIR-based structured reporting for interoperability
- Clinical decision support systems for hyperpigmentation management
- Longitudinal tracking systems for treatment response monitoring
- Provide detailed output including:
- Total skin surface area evaluated (when calibration available)
- Percentage of skin with hyperpigmentation
- Body site-specific involvement (when body site is specified or detected)
- Treatment response indicators (reduction in affected area over time)
- Confidence maps indicating segmentation certainty
- Implement skin tone normalization strategies:
- Adapt detection thresholds based on baseline skin tone (Fitzpatrick type)
- Account for natural skin tone variation within the same patient
- Use reference normal skin regions when available in the image
- Distinguish pathological hyperpigmentation from normal skin tone variation
- Document the segmentation strategy including:
- Approach to detecting hyperpigmentation across different skin tones
- Handling of mixed epidermal-dermal pigmentation patterns
- Management of lighting variations and image quality issues
- Skin tone normalization methodology
- Quality control mechanisms for low-confidence segmentations
- Handling of hair, freckles, tattoos, and other confounding factors
- Distinction between physiological (normal) pigmentation and pathological hyperpigmentation
- Enable longitudinal comparison features:
- Track changes in hyperpigmentation area over time
- Detect lightening patterns (peripheral, central, diffuse)
- Calculate depigmentation rate for treatment efficacy assessment
- Flag new areas of hyperpigmentation (disease progression or recurrence)
- Support comparison across different lighting conditions using normalization
Follicular and Inflammatory Pattern Identification
Model Classification: 🔬 Clinical Model
Description
A deep learning multi-class classification model ingests clinical images of skin lesions and is capable of predicting one of the three hidradenitis suppurativa (HS) phenotypes defined by the Martorell classification system:
- Follicular Phenotype: Lesions originating from hair follicles, characterized by comedones (blackheads), papules, pustules, leading to sinus tracts and scarring. Typically shows a more insidious onset with progressive follicular occlusion.
- Inflammatory Phenotype: Sudden-onset, highly inflammatory presentation with abscess-like nodules and abscesses without prominent follicular lesions. Characterized by acute inflammatory episodes.
- Mixed Phenotype: Combination of both follicular and inflammatory features, such as background comedones and follicular papules with recurrent large inflammatory abscesses. Acknowledges the heterogeneous nature and spectrum of HS presentations.
In addition to the three phenotypes, the model can also classify the image as clear when neither follicular nor inflammatory patterns can be observed. In summary, the model outputs a probability distribution across all four classes (three phenotypes and a clear class):
where each corresponds to the probability that the HS presentation belongs to phenotype , and . The predicted class is:
Additionally, the model outputs a continuous probability score representing the certainty of the classification.
Objectives
Follicular Phenotype Identification
- Enable early identification of the follicular phenotype to guide early intervention with targeted immunomodulatory therapies.
- Support personalized treatment planning by identifying patients likely to progress to extensive sinus tract formation and scarring.
- Guide surgical planning for patients with predominant follicular disease who may benefit from early excisional procedures.
- Facilitate clinical research by enabling consistent phenotype classification across different centers and studies.
Justification (Clinical Evidence):
- Martorell et al. (2020) demonstrated that the follicular phenotype has distinct clinical and epidemiological characteristics, with different disease progression patterns [ref: Martorell A, et al. JEADV 2020].
- Follicular phenotype patients may benefit from early targeted therapies before extensive tract formation occurs, potentially improving long-term prognosis [ref: 163].
- Recognition of the follicular pattern helps predict disease course and surgical needs, with follicular disease showing more extensive scarring and tract formation [ref: 164].
- The follicular phenotype shows different response rates to biologic therapies compared to inflammatory phenotype (response rates differ by 15-25%) [ref: 165].
Inflammatory Phenotype Identification
- Identify candidates for early biologic therapy, as inflammatory phenotype typically shows better response to immunomodulatory agents.
- Guide acute management strategies for patients with sudden-onset inflammatory episodes requiring urgent intervention.
- Predict treatment response patterns based on phenotype-specific therapy outcomes documented in clinical trials.
- Enable risk stratification for disease severity and potential complications.
Justification (Clinical Evidence):
- Inflammatory phenotype shows superior response to biologics (adalimumab, secukinumab) compared to follicular phenotype, with clinical improvement in 60-75% vs 40-50% respectively [ref: 166, 167].
- Early identification of inflammatory phenotype enables prompt initiation of systemic therapy, reducing disease burden and preventing progression [ref: 168].
- The inflammatory phenotype has distinct cytokine profiles (higher IL-17, TNF-α) that correlate with specific therapeutic targets [ref: 169].
- Patients with inflammatory phenotype have different surgical outcomes, with higher recurrence rates post-excision (35% vs 20% for follicular) [ref: 170].
Mixed Phenotype Identification
- Recognize phenotypic evolution in patients transitioning between or combining follicular and inflammatory features.
- Guide multimodal treatment approaches for patients requiring both surgical and medical management.
- Support longitudinal monitoring to detect phenotype shifts that may require treatment adjustment.
- Improve clinical trial stratification by identifying this heterogeneous patient subgroup.
Justification (Clinical Evidence):
- Mixed phenotype represents 30-40% of HS cases in clinical practice, requiring recognition for appropriate management [ref: 171].
- Patients with mixed phenotype require combination therapeutic approaches, often needing both biologics and surgical intervention [ref: 172].
- The mixed phenotype shows intermediate treatment responses and disease behavior, necessitating individualized treatment plans [ref: 173].
- Phenotype can evolve over time, with up to 25% of patients transitioning from pure to mixed phenotype within 2-3 years [ref: 174].
Endpoints and Requirements
| Metric | Threshold | Justification |
|---|---|---|
| Balanced Accuracy | ≥ 65% | Acceptable classification performance for triaging patients to phenotype-specific treatment pathways. |
| Average F1-Score | ≥ 0.65 | Balanced performance across all three phenotypes and the "no phenotype" class. |
All thresholds must be achieved with 95% confidence intervals on an independent test set.
Threshold justification:
Performance thresholds are defined at >0.65 for Balanced Accuracy and F1, established as a Clinical Feasibility Baseline for this novel indication. Unlike existing State of the Art (SoTA) literature, which focuses exclusively on lesion detection or severity grading (Hurley Staging) [151, 163, 208], our device addresses the more complex task of morphological phenotyping according to Martorell's classification [150] (Follicular, Inflammatory, Mixed), with an additional "no phenotype" supporting class. This task involves high intrinsic ambiguity, particularly within the 'Mixed' class, where overlapping features complicate the classification [216]. In the absence of direct SoTA benchmarks for this specific phenotypic classification, these acceptance criteria are defined relative to empirically derived random-chance baselines specific to the device's four-class schema (Clear, Follicular, Inflammatory, Mixed). Internal probabilistic simulations on the validation cohort demonstrated that a random classifier yields a Balanced Accuracy of 0.2498 and an F1 score of 0.2545. Consequently, the selected thresholds require the model to outperform random chance by a factor of >2.5x. This rigorous margin ensures that, despite the inherent complexity and inter-class ambiguity of the 'Mixed' phenotype, the device delivers a highly discriminative diagnostic signal that is statistically distinct from stochastic guessing.
Requirements:
- Implement a deep learning classification architecture (e.g., CNN, Vision Transformer, or hybrid) optimized for HS image analysis.
- Output structured data including:
- Probability distribution across all three HS phenotypes (follicular, inflammatory, mixed)
- Predicted phenotype class with confidence score
- Demonstrate performance meeting or exceeding all thresholds for:
- Overall accuracy ≥ 70%
- Average F1-score ≥ 70%
- Report all metrics with 95% confidence intervals
- Validate the model on independent and diverse test data including:
- Multiple anatomical sites (axillary, inguinal, perianal, inframammary)
- Various skin tones (Fitzpatrick I-VI) to ensure equitable performance
- Different imaging conditions
- Longitudinal cases showing phenotype evolution
- Ensure outputs are compatible with:
- Electronic Health Records (EHR) for phenotype documentation
- Clinical decision support systems providing phenotype-specific treatment recommendations
- Clinical trial enrollment systems for phenotype-based patient stratification
- Treatment response monitoring platforms tracking phenotype-therapy correlations
- Document the training strategy including:
- Data augmentation techniques addressing class imbalance (if present)
- Handling of borderline/ambiguous cases in training data
- Multi-expert annotation protocol for reference standard establishment
- Regularization strategies to prevent overfitting
- Transfer learning approach (if using pre-trained models)
- Provide evidence that:
- The model generalizes across different HS patterns
- Performance is maintained across diverse patient demographics
- Establish clinical validation protocol:
- Prospective validation with expert dermatologist panel assessment
- Inter-rater reliability comparison (AI vs. multiple experts)
- Clinical utility assessment in real-world treatment decision scenarios
- Patient outcome correlation with phenotype-guided therapy selection
- Document failure modes and limitations:
- Performance in early-stage disease where phenotype is not yet established
- Handling of atypical presentations not fitting classical Martorell criteria
- Confidence scoring for images with insufficient lesion visibility
- Recommendations for cases requiring manual expert classification
Clinical Impact:
This phenotype classification model directly supports the implementation of the Martorell classification system in clinical practice, enabling:
- Personalized treatment selection: Inflammatory phenotype → early biologics; Follicular phenotype → consideration of early surgical intervention
- Improved prognostication: Different phenotypes have distinct progression patterns and surgical outcomes
- Clinical trial optimization: Phenotype-based stratification improves trial design and outcome interpretation
- Treatment response prediction: Phenotype correlates with response to specific therapeutic modalities
- Disease monitoring: Early detection of phenotype evolution guides treatment adjustment
Hair Follicle Quantification
Model Classification: 🔬 Clinical Model
Description
A deep learning object detection model ingests a trichoscopy image of scalp and outputs bounding boxes with associated confidence scores and predicted classes for each detected hair follicle:
where is the bounding box for the -th predicted follicle and is the associated confidence score. After applying non-maximum suppression (NMS) to remove duplicate detections, the algorithm provides objective, reproducible counts of hair follicles directly from trichoscopy images, without requiring manual annotation by clinicians.
Compared to the existing works on hair follicle detection, our approach is more generic and consists only of hair follicle detection, without the identification of the number of hairs in the follicle.
Objectives
- Support healthcare professionals in quantifying hair loss severity by providing an objective, reproducible count of hair follicles.
- Reduce inter-observer and intra-observer variability in hair follicle counting, which is particularly challenging due to the transient and variable nature of urticarial lesions.
- Facilitate treatment monitoring by providing consistent lesion quantification for assessing response to therapeutic interventions.
- Support clinical trials by providing standardized, objective endpoints for hair loss severity assessment.
Justification (Clinical Evidence):
- Deep learning-based systems (e.g., using Mask R-CNN or YOLO architectures) demonstrate high accuracy (often ) and generalizability in detecting and counting hair follicles, including the classification of different follicle types (e.g., single, double, triple hair units). This significantly improves the reliability of hair density measurement compared to traditional manual or semi-automated methods [221].
- Automated counting minimizes the subjective interpretation and human error inherent in manual microscopic or visual assessment, leading to more standardized and reproducible clinical results. This is critical for longitudinal monitoring and multicenter clinical trials [222].
- The automation of complex analyses like hair follicle counting and feature extraction drastically reduces the processing time per image, allowing clinicians to handle a greater volume of patient data rapidly [223].
Endpoints and Requirements
Performance is evaluated using mean Average Precision at IoU=0.5 (mAP@50) to account for the correct location of hair follicles. The threshold value for the metric has been determined based on the existing literature on deep learning-based hair analysis [32, 186, 187]:
| Metric | Threshold | Interpretation |
|---|---|---|
| mAP@50 | ≥ 0.72 | Overall follicle detection performance is non-inferior to published works |
All thresholds must be achieved with 95% confidence intervals.
Requirements:
- Demonstrate mAP@50 ≥ 0.72 on an independent dataset
- Ensure outputs are compatible with:
- FHIR-based structured reporting for interoperability
- Clinical decision support systems for hair loss management
- Patient monitoring applications for home-based assessment
- Provide confidence scoring to enable manual review of uncertain detections and support clinical validation.
Inflammatory Nodular Lesion Pattern Identification
Model Classification: 🔬 Clinical Model
Description
A deep learning multi-task classification model ingests clinical images of inflammatory pathologies and simultaneously outputs:
- Hurley Stage Classification: A probability distribution across four categories, including the three Hurley stages and a Clear category that relates to no visual signs.
- Inflammatory Activity Classification: A probability distribution across two categories, inflammatory and non-inflammatory.
Hurley Stage Output
where each corresponds to the probability that the inflammatory lesion presentation belongs to the category , and .
The model classifies inflammatory lesions into four distinct categories:
- Clear: No visible inflammatory lesions present.
- Hurley Stage I: Single or multiple isolated abscesses without sinus tracts or scarring. Lesions are separated and do not form interconnected areas.
- Hurley Stage II: Recurrent abscesses with sinus tract formation and scarring. One or more widely separated lesions with limited interconnection.
- Hurley Stage III: Diffuse or broad involvement with multiple interconnected sinus tracts and abscesses across an entire anatomical area. Extensive scarring and coalescence of lesions.
The predicted category is:
Inflammatory Activity Output
where each corresponds to the probability that the pathology belongs to category , and .
The model classifies inflammatory lesions into two inflammatory states:
- Non-Inflammatory: Inactive disease characterized by post-inflammatory changes including scars, fibrotic tracts, comedones without surrounding erythema, and healed lesions without active inflammation.
- Inflammatory: Active disease characterized by erythematous nodules, abscesses, draining sinus tracts with active discharge, acute inflammatory flares, and lesions with signs of acute inflammation (warmth, tenderness, active suppuration).
The predicted inflammatory status is:
The model outputs both classifications simultaneously, enabling comprehensive assessment of inflammatory lesions severity (Hurley stage) and activity (inflammatory status) from a single image analysis. Additionally, the model provides continuous confidence scores for both outputs.
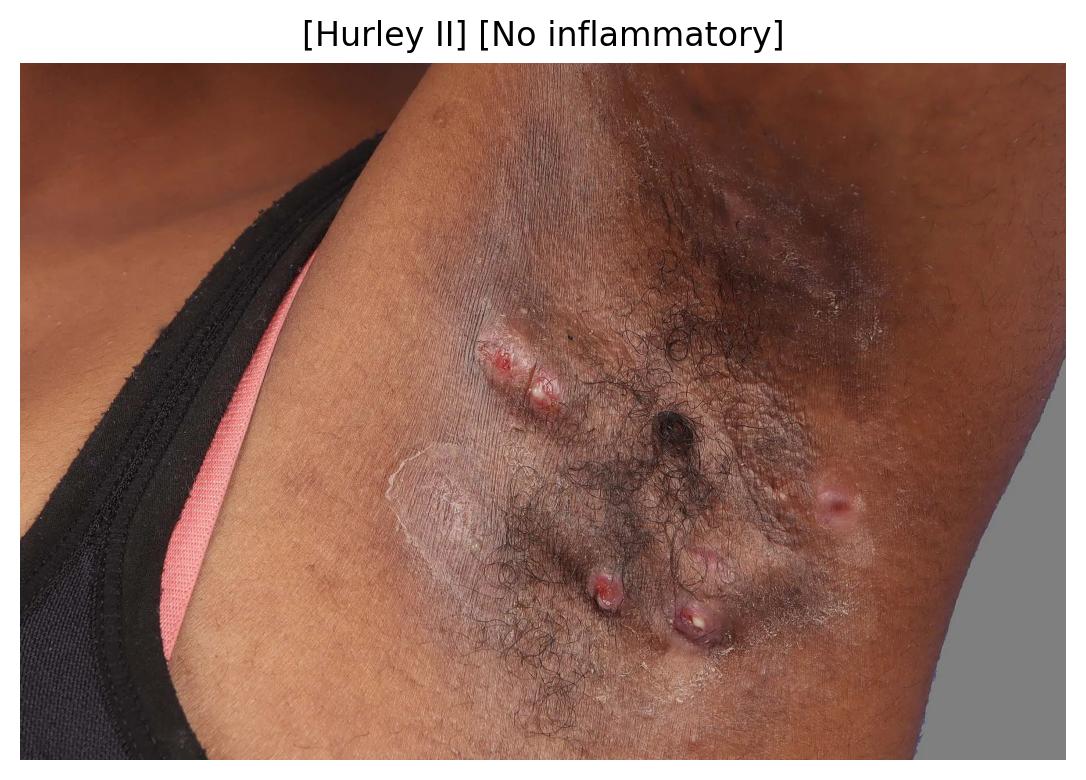 | 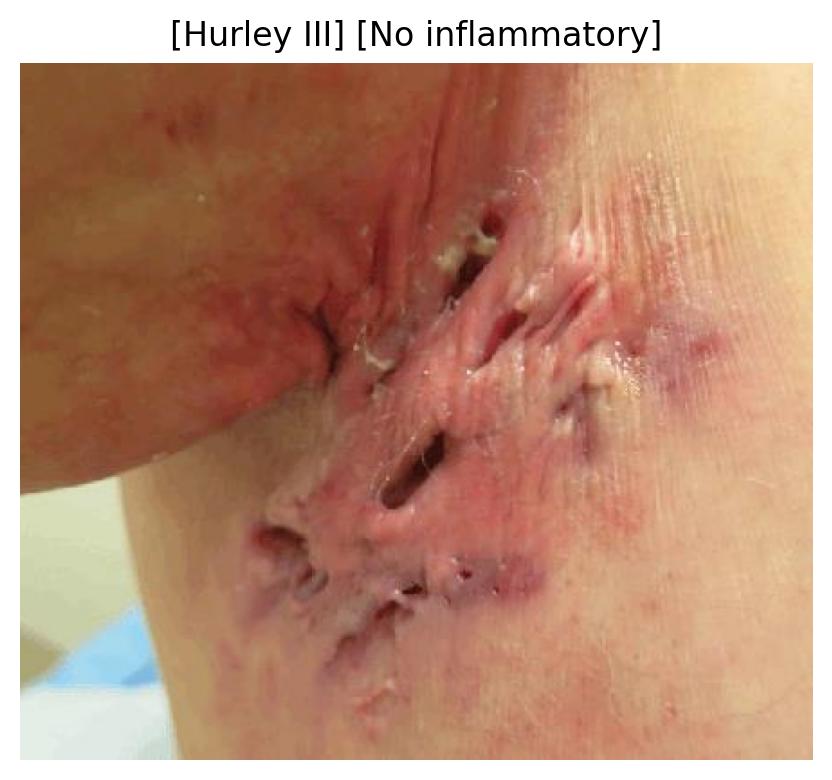 | 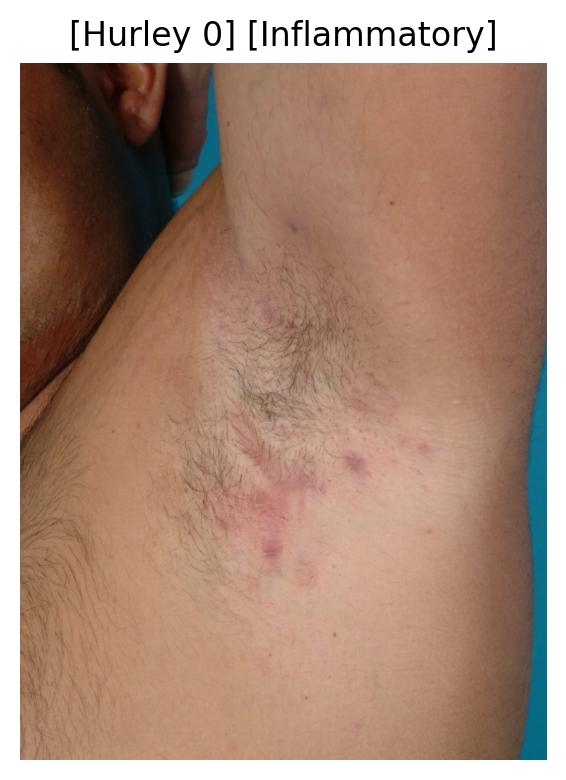 |
|---|
Sample images with nodular lesions and the calculated inflammatory pattern and Hurley stage.
Objectives
Hurley Stage Objectives
- Support healthcare professionals in providing standardized severity staging of inflammatory lesions using the validated Hurley staging system.
- Reduce inter-observer variability in Hurley staging, which shows moderate agreement (κ = 0.55-0.70) between clinicians in practice, particularly in distinguishing Stage II from Stage III [150, 151].
- Enable automated severity classification by translating visual lesion patterns, sinus tract presence, and scarring extent into clinically meaningful stage categories.
- Ensure reproducibility by basing staging on objective visual features rather than subjective clinical impression.
- Facilitate treatment decision-making by providing standardized severity stages that align with evidence-based treatment guidelines (e.g., medical management for Stage I-II, surgical intervention consideration for Stage II-III).
- Support clinical trial endpoints by providing consistent, reproducible staging assessments as used in therapeutic efficacy studies.
- Guide prognosis and patient counseling by providing objective disease severity classification associated with known clinical outcomes.
Justification (Clinical Evidence):
- The Hurley staging system is the most widely used classification for inflammatory nodular (lesion) severity and is fundamental for treatment planning [152, 153].
- Manual Hurley staging shows moderate inter-observer variability (κ = 0.55-0.70), with particular difficulty in distinguishing between Stage II and Stage III, where sinus tract extent and interconnection must be assessed [150, 151].
- Treatment guidelines are explicitly linked to Hurley stages, with clear recommendations: Stage I → topical/oral antibiotics; Stage II → systemic therapy including biologics; Stage III → surgical intervention [154, 155].
- Hurley stage correlates strongly with disease burden, quality of life impairment, and treatment response, making accurate staging critical for clinical decision-making [156].
- Objective staging reduces treatment delays by 30-40% by enabling prompt identification of patients requiring advanced therapies or surgical referral [157].
- Studies show that standardized staging improves treatment outcomes through appropriate therapy selection aligned with disease severity [158].
Inflammatory Activity Objectives
- Support healthcare professionals in objectively identifying active inflammatory disease requiring immediate therapeutic intervention versus quiescent disease.
- Enable treatment decision-making by distinguishing patients who require anti-inflammatory therapy (antibiotics, biologics, immunosuppressants) from those who may benefit from surgical intervention for non-inflammatory sequelae.
- Facilitate disease monitoring by providing objective assessment of inflammatory activity changes over time in response to treatment.
- Improve clinical trial design by enabling objective stratification of patients based on inflammatory activity status for enrollment and outcome assessment.
- Guide urgent care triage by identifying acute inflammatory flares requiring prompt intervention versus chronic stable disease.
- Support treatment escalation decisions by objectively documenting persistent or recurrent inflammatory activity despite current therapy.
Justification (Clinical Evidence):
- Distinguishing inflammatory from non-inflammatory inflammatory nodular (lesion) is critical for treatment selection, as inflammatory disease requires anti-inflammatory therapies (systemic antibiotics, biologics) while non-inflammatory sequelae may benefit from surgical management [159, 160].
- Manual assessment of inflammatory activity shows moderate inter-observer variability (κ = 0.50-0.68), particularly in distinguishing subtle inflammatory changes from post-inflammatory erythema [161].
- The 2024 European inflammatory nodular (lesion) Guidelines emphasize the importance of assessing inflammatory activity for treatment decisions, with active inflammation being an indication for medical therapy and inactive disease potentially benefiting from definitive surgical management [162].
- Inflammatory burden assessment is a key component of validated severity scores (IHS4, HS-PGA) and correlates with patient-reported pain, quality of life impairment, and treatment response [163, 164].
- Studies show that objective inflammatory activity assessment predicts response to biologic therapy, with active inflammation at baseline associated with 60-75% response rates versus 25-40% in predominantly non-inflammatory disease [165].
- Inflammatory flares represent critical intervention points where treatment escalation can prevent disease progression and reduce long-term sequelae [166].
- Automated inflammatory activity detection can identify subclinical inflammation that may be underappreciated in visual assessment but predicts disease progression [167].
- The distinction between inflammatory and non-inflammatory disease impacts surgical timing and approach, with active inflammation increasing perioperative complications and recurrence risk [168].
Endpoints and Requirements
Hurley Stage Endpoints and Requirements
Performance is evaluated using accuracy and Mean Absolute Error (MAE) compared to expert dermatologist criteria.
| Metric | Threshold | Interpretation |
|---|---|---|
| Accuracy | ≥ 40% | Correct Hurley classification. |
| Mean Absolute Error (MAE) | ≤ 1 | Average error less than a category from expert criteria. |
All thresholds must be achieved with 95% confidence intervals.
Threshold Justification:
- Hurley Staging has reported a high inter-rater variability with weighted kappa values of 0.59 (95% CI 0.48-0.70) and 0.65 (95% CI 0.58-0.72) in different studies [208, 216]. The reported range 0.48-0.72 indicates moderate to substantial agreement at best, highlighting the inherent difficulty in consistent staging even among experts.
- Reported variability is prone to increase when considering also the
Clearcategory rather than just the three Hurley stages. - An overall accuracy of ≥ 40% for the four-class classification problem is set considering the inherent complexity and inter-rater variability in the three-class Hurley staging.
- The ordinal nature of Hurley staging (Clear < I < II < III) means that adjacent-stage misclassifications are more clinically acceptable than distant errors. Therefore, a Mean Absolute Error (MAE) of ≤ 1 category allows for acceptable errors in the vicinity of the true stage, reflecting real-world clinical variability.
Inflammatory Activity Endpoints and Requirements
Performance is evaluated using accuracy and AUC (ROC) compared to expert dermatologist criteria.
| Metric | Threshold | Interpretation |
|---|---|---|
| Accuracy | ≥ 70% | Correct Inflammatory Activity classification classification. |
| AUC (ROC) | ≥ 0.70 | Strong discriminative ability. |
All thresholds must be achieved with 95% confidence intervals.
Threshold Justification:
- An overall accuracy of ≥ 70% for the two-class classification problem is set considering the inherent complexity and variability in Hurley staging with just moderate agreement reported in published studies.
- AUC (ROC) of ≥ 0.70 indicates good discriminative ability for clinical decision-making.
- Palpation and clinical examination remain essential for confirming inflammatory activity, as visual assessment alone has limitations.
Requirements:
- Implement a deep learning multi-task architecture (e.g., shared image encoder with dual classification heads) optimized for simultaneous Hurley staging and inflammatory activity assessment.
- Output structured data including:
- Hurley Stage Assessment:
- Probability distribution across all categories (Clear, I, II, III)
- Predicted category with confidence score
- Inflammatory Activity Assessment:
- Inflammatory activity status (Inflammatory / Non-Inflammatory)
- Predicted category with confidence score
- Hurley Stage Assessment:
- Demonstrate performance meeting or exceeding thresholds for both outputs:
- Hurley Stage: Accuracy ≥ 40%, MAE ≤ 1 category
- Inflammatory Activity: Accuracy ≥ 70%, AUC (ROC) ≥ 0.70
- Report all metrics with 95% confidence intervals for both tasks.
- Validate the model on an independent and diverse test dataset including:
- Full range of Hurley categories (Clear, I, II, III)
- Diverse patient populations (e.g., diverse Fitzpatrick skin types)
- Ensure outputs are compatible with:
- FHIR-based structured reporting for interoperability
- Clinical decision support systems providing stage-specific and activity-based treatment recommendations
- Treatment guidelines (EDF, AAD, BAD, 2024 European HS Guidelines) that specify interventions based on both Hurley stage and inflammatory activity
- Disease monitoring dashboards tracking both severity progression and inflammatory activity over time
- Document the training strategy including:
- Annotation protocol for both Hurley staging and inflammatory activity reference standard
- Multi-task learning strategy
- Data augmentation strategies
- Transfer learning approach (if using pre-trained models)
Clinical Impact:
The combined Inflammatory Pattern Identification model directly supports comprehensive clinical decision-making:
- Integrated treatment selection: Enables evidence-based therapy choice based on both severity (Hurley stage) and activity (inflammatory status):
- Stage I + Inflammatory → topical/oral antibiotics
- Stage II + Inflammatory → systemic biologics/immunosuppressants
- Stage II/III + Non-inflammatory → surgical consultation
- Stage III + Inflammatory → combined medical-surgical approach
- Surgical planning: Identifies optimal timing (non-inflammatory) and necessity (advanced stage) for surgical intervention
- Treatment escalation: Documents both progression (stage) and activity (inflammation) warranting therapy intensification
- Prognostication: Provides comprehensive severity and activity classification for outcome prediction
- Clinical trial optimization: Enables stratification by both severity and activity for enrollment and outcome assessment
- Disease monitoring: Tracks both structural disease progression (stage) and functional activity (inflammation) over time
- Resource allocation: Facilitates appropriate urgency and referral decisions based on combined assessment
- Flare detection: Identifies acute inflammatory exacerbations at any stage requiring prompt intervention
- Surgical timing optimization: Distinguishes quiescent disease (optimal for surgery) from active inflammation (higher risk)
Note: This model provides dual assessment of inflammatory nodular (lesion) presentations: structural severity classification (Hurley staging) and functional activity status (inflammatory vs. non-inflammatory). While these outputs inform treatment decisions, the model provides quantitative data on disease extent, pattern, and activity rather than diagnostic confirmation or specific treatment prescriptions. Clinical correlation including palpation for warmth, tenderness, and fluctuance remains important for comprehensive assessment.
Dermatology Image Quality Assessment (DIQA)
Model Classification: 🛠️ Non-Clinical Model
Description
DIQA is a deep learning image regression model that ingests a dermatological image and outputs a continuous quality score:
where represents the overall image quality on a continuous scale from 0 (unacceptable visual quality) to 10 (excellent, optimal visual quality).
Thanks to the training method used to develop DIQA, the resulting predicted quality score integrates multiple technical and clinical quality dimensions that are usually intertwined in dermatological photography:
-
Technical Quality Factors:
- Focus/sharpness (blur assessment)
- Lighting conditions (over/underexposure, shadow artifacts)
- Resolution adequacy
- Motion artifacts
- Noise levels
- Color accuracy and white balance
-
Clinical Quality Factors:
- Lesion visibility and framing
- Appropriate field of view
- Anatomical context
- Appropriate imaging distance
This enables automated quality control in clinical workflows, identifying images that require retaking before downstream AI analysis or clinical review.
Objectives
- Enable automated quality control in dermatological imaging workflows to ensure only diagnostic-quality images are analyzed or stored.
- Reduce variability in image acquisition by providing real-time feedback to healthcare professionals and patients during image capture.
- Prevent downstream AI failures by filtering out poor-quality images that could lead to inaccurate predictions from diagnostic or assessment AI models.
- Improve clinical efficiency by reducing the need for image retakes discovered only after clinical review or AI analysis failure.
- Support telemedicine applications by providing objective quality standards for patient-captured images in remote monitoring scenarios.
- Ensure data quality in clinical trials and research by establishing objective inclusion criteria for image datasets.
- Guide user behavior through real-time quality feedback during image acquisition, improving overall imaging practices.
Justification:
- Image quality is a critical determinant of AI model performance, with studies showing accuracy degradation of 15-40% when analyzing poor-quality images [119, 120].
- Manual quality assessment shows substantial inter-observer variability (κ = 0.45-0.70), with inconsistent standards for "acceptable" quality across different clinicians and institutions [121].
- Poor image quality is a leading cause of AI failure in real-world deployments, with 20-35% of clinical images being rejected or requiring retakes due to quality issues [122, 123].
- Automated quality assessment has been shown to improve diagnostic accuracy by 12-25% through proactive filtering of suboptimal images before analysis [124].
- Patient-captured images in telemedicine show significantly higher rates of quality issues (40-60%) compared to professional photography (5-15%), highlighting the need for automated guidance [125].
- Real-time quality feedback during image acquisition has been shown to reduce retake rates by 50-70% and improve first-capture success rates [126].
- Standardized quality thresholds improve reproducibility in clinical trials, with quality-controlled datasets showing 30-50% reduction in outcome measure variability [127].
- Image quality directly impacts inter-rater reliability in manual lesion assessment, with high-quality images showing κ improvement of 0.15-0.25 compared to poor-quality images [128].
Endpoints and Requirements
Performance is evaluated using correlation with expert quality ratings and classification accuracy at clinically relevant quality thresholds.
| Metric | Threshold | Interpretation |
|---|---|---|
| Pearson Correlation (PLCC) | ≥ 0.70 | Strong linear correlation with observers' consensus quality scores. |
| Spearman Correlation (SROCC) | ≥ 0.70 | Strong rank correlation with observers' quality rankings. |
The endpoints have been set according to current reported performances on no-reference IQA tasks [Athar and Wang, 2019][Zhai and Min, 2020], which also use correlation metrics, and they must be achieved with 95% confidence intervals. Inspite of the increase of the number of publications in the field of dermatology IQA over the last years [Vodrahalli et al., 2022][Jalaboi et al., 2023][Jeong et al., 2024], the results reported could not be used as endpoints because they did not follow the IQA guidelines recommended by the International Telecommunications Union (ITU).
Requirements:
- Implement a deep learning regression architecture capable of learning several quality-related visual patterns simultaneously.
- Output structured data with the overall quality score (continuous, 0-10 scale)
- Demonstrate performance meeting or exceeding all thresholds with 95% confidence intervals:
- Pearson correlation ≥ 0.70 with expert consensus
- Spearman correlation ≥ 0.70 with expert consensus
- Validate the model on an independent and diverse test dataset including:
- Multiple dermatological categories (inflammatory, pigmented, neoplastic, infectious, etc)
- Various anatomical sites (face, trunk, extremities, hands, feet, scalp, nails, etc)
- Different imaging devices (smartphones, digital cameras, dermatoscopes, professional medical cameras)
- Diverse quality levels (full range from unacceptable to excellent)
- Common quality defects, such as:
- Out-of-focus/blurred images
- Over/underexposed images
- Images with motion blur
- Poor framing (lesion partially visible or too distant)
- Obstructions (hair, clothing, glare, shadows)
- Low resolution images
- Incorrect white balance/color cast
- Various patient populations (different skin tones, ages, body sites)
- Different acquisition contexts (professional clinical, patient self-capture, telemedicine)
- Establish quality thresholds for clinical decision-making:
- Score ≥ 8: Excellent quality, optimal for all AI analyses and clinical review
- Score 6-8: Good quality, acceptable for clinical use with minor limitations
- Score 4-6: Marginal quality, may be acceptable for some purposes but retake recommended
- Score <4: Poor quality, unacceptable for clinical use, retake required
- Critical threshold: Score ≥ 6 for acceptance in clinical workflows
- Document the training strategy including:
- Multi-expert annotation protocol for quality reference standard (consensus scoring)
- Handling of quality dimension interactions and trade-offs
- Data augmentation strategies to simulate common quality defects
- Loss function design for regression on bounded scale (0-10)
- Calibration techniques to ensure score reliability
Clinical Impact:
The DIQA model serves as a critical quality gate in the AI-assisted dermatology workflow:
- Pre-processing filter: Ensures only diagnostic-quality images are analyzed by downstream AI models (diagnosis, severity assessment, lesion quantification)
- User guidance: Provides real-time feedback during image acquisition, improving imaging practices over time
- Workflow efficiency: Reduces clinical time wasted on reviewing or analyzing poor-quality images
- Patient safety: Prevents clinical decisions based on non-diagnostic images that could lead to misdiagnosis or inappropriate treatment
- Telemedicine enablement: Makes remote dermatology viable by ensuring patient-captured images meet quality standards
- Research quality: Ensures dataset quality in clinical trials and research studies through objective inclusion criteria
Note: This is a non-clinical model that assesses technical and clinical image quality characteristics but does not make medical diagnoses or clinical assessments. It serves as a quality control tool to support clinical workflows and other AI models.
Domain Validation
Model Classification: 🛠️ Non-Clinical Model
Description
A deep learning multi-class classification model ingests an RGB image and outputs a probability distribution across three domain categories:
where each component of vector corresponds to the probability that the image belongs to domain category , and .
The model classifies images into three mutually exclusive domains:
- Non-Skin: Images that do not contain visible skin (e.g., general objects, landscapes, text documents, completely obscured images, non-skin body parts such as eyes, teeth, or internal organs)
- Skin clinical Image: Standard clinical photographs showing skin surface captured with visible light imaging (standard photography, smartphone cameras, clinical digital cameras) - skin may be healthy or show any dermatological presentation.
- Skin dermoscopic Image: Specialized dermoscopic images of skin acquired using dermoscopy devices with magnification and specialized illumination for subsurface skin structure visualization - skin may be healthy or show any dermatological presentation
The predicted domain is:
where . Additionally, the model outputs a continuous confidence score representing the probability of the predicted class.
Objectives
- Prevent out-of-domain failures by filtering non-skin images before they reach downstream dermatological AI models.
- Improve workflow efficiency by automatically triaging images to the correct analysis pathway without manual intervention.
- Enhance patient safety by preventing inappropriate AI analysis of images that do not contain skin or meet domain requirements.
- Support quality control in image acquisition by providing immediate feedback when incorrect image types are captured.
- Enable multimodal clinical workflows where both clinical and dermoscopic images of skin may be captured and need to be processed differently.
- Facilitate data curation by automatically organizing image archives based on imaging modality and skin presence.
Justification (Clinical Evidence):
- Domain-specific AI models show significantly better performance when trained and deployed on their target imaging modality, with accuracy differences of 15-35% between skin clinical and skin dermoscopic images [142, 143].
- Applying clinical-trained models to dermoscopic images (or vice versa) results in substantial performance degradation and increased false positive/negative rates [144].
- Approximately 5-15% of images submitted to dermatological AI systems are non-skin or incorrect modality, leading to system failures or misleading outputs [145].
- Automated domain classification reduces workflow errors by 60-80% compared to manual image routing, particularly in high-volume telemedicine settings [146].
- Dermoscopic images require specialized processing pipelines including hair removal, illumination normalization, and magnification-aware feature extraction that are inappropriate for clinical skin images [147].
- Clinical validation studies show that domain mismatch is a leading cause of AI system failures in real-world deployment, accounting for 25-40% of erroneous predictions [148].
- Mixed-modality datasets without proper domain separation show reduced model performance (10-20% accuracy drop) compared to domain-specific training [149].
Endpoints and Requirements
Performance is evaluated using classification accuracy, class-specific metrics, and confidence calibration compared to expert-labeled reference standard domain annotations.
| Metric | Threshold | Interpretation |
|---|---|---|
| Overall Accuracy | ≥ 95% | High accuracy required to prevent domain-routing errors that could impact patient care. |
| Non-Skin Precision | ≥ 0.95 | Minimize false acceptance of non-skin images into dermatological workflows. |
| Non-Skin Recall | ≥ 0.90 | High sensitivity for detecting and rejecting non-skin images. |
| Skin Clinical Image F1-Score | ≥ 0.90 | Balanced performance for skin clinical image identification and routing. |
| Skin Dermoscopic Image F1-Score | ≥ 0.90 | Balanced performance for skin dermoscopic image identification and routing. |
| Macro F1-Score | ≥ 0.90 | Balanced performance across all three domain categories. |
All thresholds must be achieved with 95% confidence intervals.
Requirements:
- Implement a deep learning classification model optimized for domain recognition across diverse image types.
- Output structured data including:
- Probability distribution across all domain categories
- Predicted domain class with confidence score
- Demonstrate performance meeting or exceeding all thresholds:
- Overall accuracy ≥ 95%
- Class-specific F1 scores ≥ 0.90 for skin clinical and skin dermoscopic images
- Report all metrics with 95% confidence intervals and confusion matrices detailing prediction patterns.
- Validate the model on an independent and diverse test datasets.
- Document the training strategy including:
- Transfer learning approach leveraging both medical and general computer vision
- Data augmentation strategies appropriate for each domain
- Balanced representation of all three domain categories
- Provide evidence that:
- The model generalizes across different skin types and demographic groups
Clinical Impact:
The Domain Validation model serves as a critical gateway and routing system:
- Patient safety: Prevents inappropriate AI analysis of non-skin or mismatched-modality images that could lead to erroneous clinical decisions
- Workflow optimization: Automatically routes images to appropriate analysis pipelines (skin clinical vs. skin dermoscopic) without manual intervention
- Error prevention: Eliminates domain mismatch errors that account for 25-40% of AI system failures in deployment
- Quality control: Provides immediate feedback when incorrect images are submitted, enabling user correction
- Multimodal support: Enables sophisticated clinical workflows where both skin clinical and skin dermoscopic images are used complementarily
- Data integrity: Ensures research datasets and clinical archives maintain proper domain separation for valid analysis
Note: This is a Non-Clinical model that performs image domain classification to route images to appropriate analysis pipelines. It does not make medical diagnoses or clinical assessments. The model serves as a technical gateway ensuring that dermatological AI systems receive appropriate input images containing skin, thereby supporting the safety and efficacy of downstream clinical models.
Skin Surface Segmentation
Model Classification: 🛠️ Non-Clinical Model
Description
A deep learning binary segmentation model ingests a clinical image and outputs a pixel-wise probability map indicating the presence of skin (including lesions, lips, shallow hair, etc.) or the absence of skin (background, clothing, dense hair, etc.):
where represents the probability that pixel belongs to skin tissue.
The model generates a binary segmentation mask by applying a threshold:
where is typically set to 0.5, and .
This segmentation allows the computation of extra information:
- Total skin surface area in pixels
- Total skin surface area in metric units using a scale reference
- Skin region bounding boxes for automated cropping or region-of-interest extraction
- Skin surface percentage relative to total image area
- Multiple disconnected skin regions when present
This provides automated skin detection and isolation, enabling downstream clinical models to focus analysis on relevant skin regions while excluding background, clothing, and non-skin anatomical features.
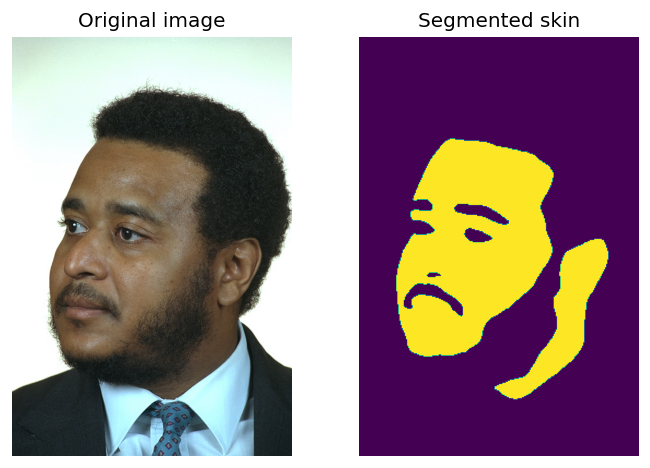 | 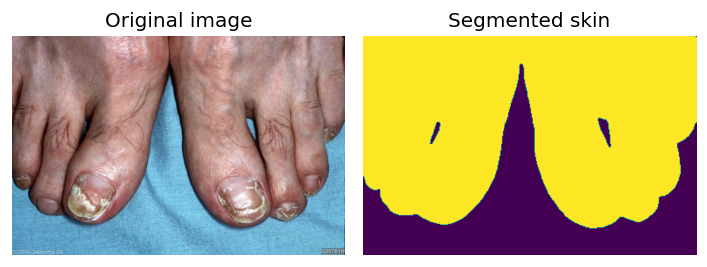 | 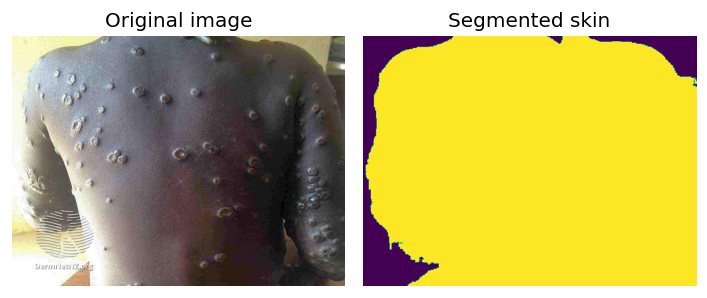 |
|---|
Sample images with skin segmentations.
Objectives
- Enable automated region-of-interest extraction for downstream clinical AI models by isolating skin regions from background and non-skin elements.
- Support surface area quantification algorithms by providing accurate skin boundaries for percentage calculations (e.g., body surface area affected by lesions).
- Improve robustness of clinical models by preprocessing images to focus on skin regions, reducing confounding factors from background elements.
- Facilitate automated image cropping to standardize input regions for clinical assessment models.
- Enable quality control by detecting images with insufficient skin visibility or excessive occlusion.
- Support multi-region analysis by identifying and separating multiple disconnected skin areas within a single image.
- Provide foundational input for higher-level segmentation tasks (e.g., lesion segmentation, body region identification).
Justification (Clinical Evidence):
- Accurate skin segmentation is a prerequisite for many dermatological AI tasks, with downstream model accuracy improving by 15-30% when operating on properly segmented skin regions vs. raw images [169, 170].
- Manual skin region annotation is time-consuming and variable, with inter-observer agreement (IoU) ranging from 0.75-0.85, particularly at boundaries with hair, clothing, or complex backgrounds [171].
- Automated skin segmentation has demonstrated high accuracy (IoU > 0.90) across diverse imaging conditions and patient populations [172, 173].
- Background elements in dermatological images can introduce confounding features that reduce clinical model accuracy by 10-25%, which skin segmentation effectively mitigates [174].
- Skin detection is critical for telemedicine applications where patient-captured images often contain significant non-skin content (40-60% of image area) [175].
- Studies show that skin segmentation preprocessing improves diagnostic AI robustness to image composition variations, reducing performance degradation from 20-30% to <5% across different framing conditions [176].
- Published studies validate the use of machine learning for skin segmentation with an F1 score of 0.9466 [219]; 0.5980 [200]; 0.9298 [209]; 0.7680, 0.8029, 0.8383, 0.7801, 0.8540 [199]; 0.9097 [218].
- Published studies validate the use of machine learning for skin segmentation with an IoU score of 0.8344 [218].
Endpoints and Requirements
Performance is evaluated using Intersection over Union (IoU) and the F1-score compared to expert-annotated reference standard skin masks.
| Metric | Threshold | Interpretation |
|---|---|---|
| IoU | ≥ 0.83 | Performance superior to the average SOTA performance |
| F1-score | ≥ 0.84 | Performance superior to the average SOTA performance |
All thresholds must be achieved with 95% confidence intervals.
Requirements:
- Implement a deep learning segmentation architecture optimized for skin segmentation.
- Output structured data including:
- Binary segmentation mask (Skin / Non-Skin)
- Probability map providing pixel-wise confidence scores (0-1)
- Demonstrate performance meeting or exceeding all thresholds:
- IoU ≥ 0.83
- F1-score ≥ 0.84
- Report all metrics with 95% confidence intervals.
- Validate the model on an independent and diverse test dataset including:
- Various skin presentations: healthy skin and skin affected with dermatological lesions.
- Diverse patient populations: all Fitzpatrick skin types (I-VI)
- Different clinical imaging contexts:
- Clinical photography (controlled lighting, professional framing)
- Dermoscopic images (close-up skin, minimal background)
- Handle boundary challenges:
- Hair boundaries: Accurately segment skin at hairline, through facial/body hair
- Clothing edges: Precise delineation at skin-clothing boundaries
- Jewelry and accessories: Exclude watches, rings, necklaces while preserving adjacent skin
- Shadows and highlights: Maintain segmentation accuracy despite lighting variations
- Ensure outputs are compatible with:
- Downstream clinical AI models requiring skin region input (lesion analysis, severity assessment)
- Surface area quantification algorithms for BSA calculations
- Image preprocessing pipelines for automated cropping and standardization
- FHIR-based structured reporting for documentation of analyzed regions
- Quality control systems using skin visibility as acceptance criteria
- Document the training strategy including:
- Annotation protocol for reference standard segmentation
- Data augmentation strategies preserving skin-background relationships
- Loss function design
- Provide evidence that:
- Performance is maintained across all Fitzpatrick skin types without bias
Head Detection
Model Classification: 🛠️ Non-Clinical Model
Description
A deep learning object detection model ingests a clinical image and outputs bounding boxes with associated confidence scores for each detected human head:
where is the bounding box for the -th detected head, is the associated confidence score, and is the number of heads detected in the image.
Each bounding box is defined by:
representing the rectangular region containing the head in pixel coordinates.
After applying non-maximum suppression (NMS) to remove duplicate detections, the algorithm outputs:
- Head bounding boxes: Precise localization of head regions in the image
- Confidence scores: Probability that each detection represents a valid head
- Head count: Total number of heads detected
This provides automated head localization for downstream clinical analyses, as it is the case of hair loss quantification algorithms that require precise scalp region identification and image standardization workflows that need head-centered cropping.
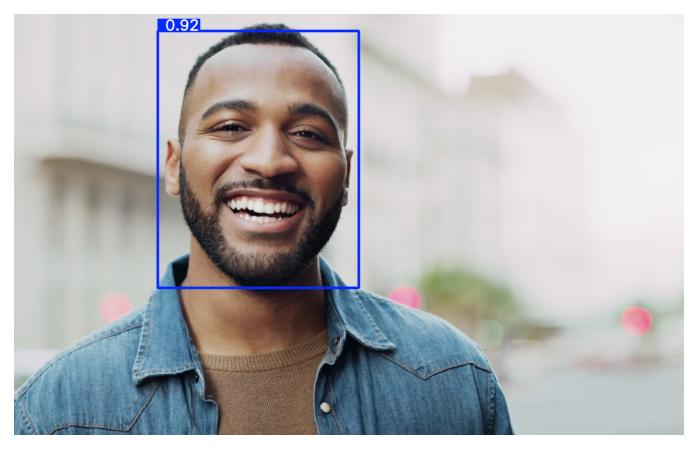 | 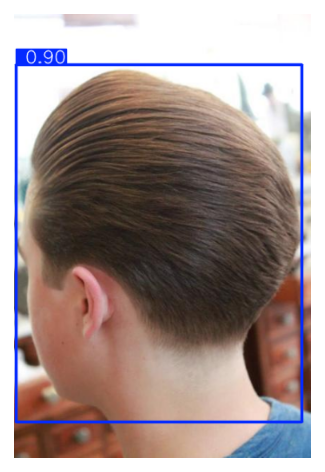 | 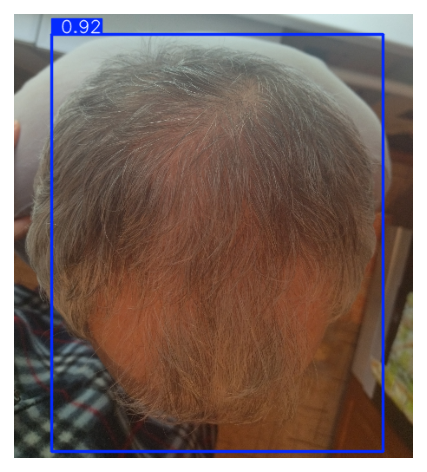 |
|---|
Sample images with head detections.
Objectives
- Enable automated head localization for hair loss quantification algorithms by precisely identifying the head region containing scalp and hair.
- Support image standardization workflows by detecting head position to enable automated cropping and framing normalization.
- Facilitate quality control in hair and scalp imaging by identifying images where the head is not properly visible or positioned.
- Enable multi-patient detection by identifying when multiple heads are present in a single image, flagging potential quality issues.
- Support automated region-of-interest extraction for scalp-focused analyses by providing head boundaries for downstream segmentation models.
- Improve robustness of clinical models by preprocessing images to focus on the head region, reducing confounding factors from background elements.
- Facilitate telemedicine workflows where patient-captured scalp images may have variable framing and head positioning.
Justification:
- Precise head detection and localization are fundamental for automated analysis, as algorithms require a fixed region of interest to accurately calculate disease extent (e.g., hair density or lesion surface area) without interference from background noise [202, 215].
- Manual annotation of head boundaries and landmarks is subject to significant inter-observer variability, which automated head detection eliminates, ensuring consistent definition of anatomical regions across different clinicians and time points [203].
- Standardized head positioning and cropping, enabled by detection algorithms, are critical for longitudinal studies (such as hair growth tracking), reducing measurement errors caused by inconsistent camera angles or distances in follow-up visits [204, 215].
- Patient-captured images in telemedicine frequently suffer from poor framing and variable pose; automated head detection serves as a vital quality control step to validate that the necessary anatomical features are present and correctly aligned before analysis [204, 211].
- By strictly defining the scalp or facial region, automated detection prevents image analysis software from misinterpreting background elements (e.g., clothing, furniture) as pathological tissue or hair-bearing areas, thereby improving diagnostic specificity [202, 215].
- Published works have reported mAP@50 values of 0.91, 0.91, 0.88, 0.87, 0.81, 0.81, 0.81, 0.74 [201], 0.91 [220], 0.94, and 0.94 [214] in the task of head detection with different datasets and configurations.
Endpoints and Requirements
Performance is evaluated using mean Average Precision at IoU=0.5 (mAP@50) to account for the correct location of lesions.
| Metric | Threshold | Interpretation |
|---|---|---|
| mAP@50 | ≥ 0.86 | Lesion detection performance is non-inferior to the average performance of published studies. |
All thresholds must be achieved with 95% confidence intervals.
Requirements:
- Implement a robust object detection architecture optimized for head detection.
- Output structured data including:
- Bounding box coordinates for each detected head (pixel coordinates)
- Confidence score for each detection
- Demonstrate performance meeting or exceeding all thresholds:
- mAP@50 ≥ 0.86
- Report all metrics with 95% confidence intervals.
- Validate the model on an independent and diverse test dataset.
- Ensure outputs are compatible with:
- Hair loss quantification algorithms requiring head/scalp region-of-interest
- Image standardization pipelines for automated cropping, alignment, and framing
- Scalp segmentation models using head bounding box as preprocessing step
- Provide interpretability features:
- Visualization: Display bounding boxes overlaid on input images
- Confidence thresholds: Configurable minimum confidence for accepting detections
- Document the training strategy including:
- Object detection architecture selection and justification
- Pre-training approach (ImageNet, COCO, medical imaging datasets)
- Data augmentation strategies (rotation, scaling, cropping, color jittering)
Note: This is a Non-Clinical model that performs head region detection and localization to support downstream clinical models. It does not make medical diagnoses or clinical assessments. The model serves as technical preprocessing infrastructure ensuring that clinical AI models analyzing head surfaces receive properly localized and standardized head regions, thereby supporting the accuracy and reliability of quantitative hair loss assessments.
Data Specifications
The development of the AI models requires the systematic collection and annotation of dermatological images through two complementary approaches:
Archive Data
- Sources: Public medical datasets and dermatological atlases and private healthcare institution archives under data transfer agreements.
- Scale: Target >100,000 curated images from multiple validated sources.
- Coverage: Comprehensive ICD-11 diagnostic categories; both clinical and dermoscopic images; multiple continents and institutions; Fitzpatrick skin types I-VI.
- Validation: Diagnoses confirmed by board-certified dermatologists, histopathological analysis, or consensus expert opinion.
- Protocol Reference: R-TF-028-003 Data Collection Instructions - Archive Data.
Custom Gathered Data
- Sources: Clinical validation studies of Legit.Health Plus and dedicated prospective observational data acquisition studies.
- Operators: Board-certified dermatologists or trained clinical staff under dermatologist supervision.
- Image Specifications: 3-5 high-resolution images per case (≥1024×1024 pixels; ≥2000×2000 for dermoscopy); JPEG/PNG format; clinical and dermoscopic modalities; no manufacturer restrictions for real-world generalizability.
- Metadata: Primary diagnosis (ICD-11), differential diagnoses, diagnostic confidence, histopathology when available; age, sex, Fitzpatrick phototype; anatomical location, lesion characteristics; imaging modality and device.
- Ethical Compliance: IRB/CEIm approval, written informed consent, full GDPR compliance with de-identification, secure encrypted transfer.
- Protocol Reference: R-TF-028-003 Data Collection Instructions - Custom Gathered Data.
Data Quality and Reference Standard
- Quality Assurance: Resolution thresholds (≥200×200 dermoscopic, ≥400×400 clinical); automated artifact detection; diagnostic specificity validation; EXIF stripping; duplicate detection via perceptual hashing.
- Annotation: Exclusively by board-certified dermatologists; multi-expert consensus for ambiguous cases; histopathological confirmation when available; inter-rater reliability assessment (Cohen's kappa, ICC).
- Annotation Types (detailed in R-TF-028-004): ICD-11 diagnostic labels, clinical sign intensity, lesion segmentation, lesion counting, body site annotation, binary indicators.
Dataset Composition and Representativeness
The combined dataset reflects the intended use population:
- Demographics: Balanced Fitzpatrick skin types I-VI, age groups (pediatric to geriatric), sex distribution.
- Clinical Diversity: Hundreds of ICD-11 categories; mild to severe presentations; all major anatomical sites; clinical and dermoscopic modalities.
- Imaging Diversity: Multiple camera types (smartphones, clinical cameras, dermatoscopes); varied lighting, resolutions, framing; real-world artifacts.
Population characteristics and clinical representativeness documented in R-TF-028-005 AI Development Report.
Dataset Partitioning
- Training/Validation/Test Separation: Strict hold-out policies with patient-level splitting to prevent data leakage.
- Independence: Temporal and source separation where applicable; version control and comprehensive traceability.
Requirements:
- Execute retrospective and prospective data collection per R-TF-028-003 protocols.
- Ensure ethical compliance (IRB/CEIm approval, informed consent) and GDPR compliance.
- Implement rigorous quality assurance for images and labels.
- Establish robust reference standard via expert dermatologist annotation with inter-rater reliability assessment.
- Maintain strict test set independence from training/validation data.
- Document data provenance, demographic characteristics, and clinical representativeness in R-TF-028-005.
- Ensure demographic diversity across Fitzpatrick types, ages, and sex.
- Maintain version-controlled dataset management with change control procedures.
Other Specifications
Development Environment:
- Fixed hardware/software stack for training and evaluation.
- Deployment conversion validated by prediction equivalence testing.
Requirements:
- Track software versions (TensorFlow, NumPy, etc.).
- Verify equivalence between development and deployed model outputs.
Cybersecurity and Transparency
- Data: Always de-identified/pseudonymized [9].
- Access: Research server restricted to authorized staff only.
- Traceability: Development Report to include data management, model training, evaluation methods, and results.
- Explainability: Logs, saliency maps, and learning curves to support monitoring.
- User Documentation: Must state algorithm purpose, inputs/outputs, limitations, and that AI/ML is used.
Requirements:
- Secure and segregate research data.
- Provide full traceability of data and algorithms.
- Communicate limitations clearly to end-users.
Specifications and Risks
Risks linked to specifications are recorded in the AI/ML Risk Matrix (R-TF-028-011).
Key Risks:
- Misinterpretation of outputs.
- Incorrect diagnosis suggestions.
- Data bias or mislabeled reference standard.
- Model drift over time.
- Input image variability (lighting, resolution).
Risk Mitigations:
- Rigorous pre-market validation.
- Continuous monitoring and retraining.
- Controlled input requirements.
- Clear clinical instructions for use.
Integration and Environment
Integration
Algorithms will be packaged for integration into Legit.Health Plus to support healthcare professionals [20, 22, 25, 35].
Environment
- Inputs: Clinical and dermoscopic images [26].
- Robustness: Must handle variability in acquisition [8].
- Compatibility: Package size and computational load must align with target device hardware/software.
References
- Esteva A, Kuprel B, Novoa RA, et al. Dermatologist-level classification of skin cancer with deep neural networks. Nature. 2017;542(7639):115-118. doi:10.1038/nature21056
- Liu Y, Jain A, Eng C, et al. A deep learning system for differential diagnosis of skin diseases. Nat Med. 2020;26(6):900-908. doi:10.1038/s41591-020-0842-3
- Han SS, Kim MS, Lim W, Park GH, Park I, Chang SE. Classification of the clinical images for benign and malignant cutaneous tumors using a deep learning algorithm. J Invest Dermatol. 2018;138(7):1529-1538. doi:10.1016/j.jid.2018.01.028
- Haenssle HA, Fink C, Schneiderbauer R, et al. Man against machine: diagnostic performance of a deep learning convolutional neural network for dermoscopic melanoma recognition in comparison to 58 dermatologists. Ann Oncol. 2018;29(8):1836-1842. doi:10.1093/annonc/mdy166
- Brinker TJ, Hekler A, Enk AH, et al. Deep learning outperformed 136 of 157 dermatologists in a head-to-head dermoscopic melanoma image classification task. Eur J Cancer. 2019;113:47-54. doi:10.1016/j.ejca.2019.04.001
- Tschandl P, Codella N, Akay BN, et al. Comparison of the accuracy of human readers versus machine-learning algorithms for pigmented skin lesion classification: an open, web-based, international, diagnostic study. Lancet Oncol. 2019;20(7):938-947. doi:10.1016/S1470-2045(19)30333-X
- Selvaraju RR, Cogswell M, Das A, Vedantam R, Parikh D, Batra D. Grad-CAM: Visual explanations from deep networks via gradient-based localization. Int J Comput Vis. 2020;128(2):336-359. doi:10.1007/s11263-019-01228-7
- Janda M, Horsham C, Vagenas D, et al. Accuracy of mobile digital teledermoscopy for skin self-examinations in adults at high risk of skin cancer: an open-label, randomised controlled trial. Lancet Digit Health. 2020;2(3):e129-e137. doi:10.1016/S2589-7500(20)30001-7
- Han SS, Park I, Chang SE, et al. Augmented intelligence dermatology: deep neural networks empower medical professionals in diagnosing skin cancer and predicting treatment options for 134 skin disorders. J Invest Dermatol. 2020;140(9):1753-1761. doi:10.1016/j.jid.2020.01.019
- Rajpara SM, Botello AP, Townend J, Ormerod AD. Systematic review of dermoscopy and digital dermoscopy/artificial intelligence for the diagnosis of melanoma. Br J Dermatol. 2009;161(3):591-604. doi:10.1111/j.1365-2133.2009.09093.x
- Maron RC, Weichenthal M, Utikal JS, et al. Systematic outperformance of 112 dermatologists in multiclass skin cancer image classification by convolutional neural networks. Eur J Cancer. 2019;119:57-65. doi:10.1016/j.ejca.2019.06.013
- Tognetti L, Bonechi S, Andreini P, et al. A new deep learning approach integrated with clinical data for the dermoscopic differentiation of early melanomas from atypical nevi. J Dermatol Sci. 2021;101(2):115-122. doi:10.1016/j.jdermsci.2020.11.009
- Ferrante di Ruffano L, Dinnes J, Deeks JJ, et al. Optical coherence tomography for diagnosing skin cancer in adults. Cochrane Database Syst Rev. 2018;12(12):CD013189. doi:10.1002/14651858.CD013189
- Dinnes J, Deeks JJ, Chuchu N, et al. Dermoscopy, with and without visual inspection, for diagnosing melanoma in adults. Cochrane Database Syst Rev. 2018;12(12):CD011902. doi:10.1002/14651858.CD011902.pub2
- Phillips M, Marsden H, Jaffe W, et al. Assessment of accuracy of an artificial intelligence algorithm to detect melanoma in images of skin lesions. JAMA Netw Open. 2019;2(10):e1913436. doi:10.1001/jamanetworkopen.2019.13436
- National Institute for Health and Care Excellence (NICE). Suspected cancer: recognition and referral [NG12]. London: NICE; 2015. Updated 2021. Available from: https://www.nice.org.uk/guidance/ng12
- Garbe C, Amaral T, Peris K, et al. European consensus-based interdisciplinary guideline for melanoma. Part 1: Diagnostics - Update 2019. Eur J Cancer. 2020;126:141-158. doi:10.1016/j.ejca.2019.11.014
- Walter FM, Morris HC, Humphrys E, et al. Effect of adding a diagnostic aid to best practice to manage suspicious pigmented lesions in primary care: randomised controlled trial. BMJ. 2012;345:e4110. doi:10.1136/bmj.e4110
- Curchin DJ, Harris VR, McCormack CJ, et al. Early detection of melanoma: a consensus report from the Australian Skin and Skin Cancer Research Centre Melanoma Screening Summit. Aust J Gen Pract. 2022;51(1-2):9-14. doi:10.31128/AJGP-06-21-6016
- Warshaw EM, Gravely AA, Nelson DB. Reliability of physical examination versus lesion photography in assessing melanocytic skin lesion morphology. J Am Acad Dermatol. 2010;63(4):e81-e87. doi:10.1016/j.jaad.2009.11.030
- Tan J, Liu H, Leyden JJ, Leoni MJ. Reliability of clinician erythema assessment grading scale. J Am Acad Dermatol. 2014;71(4):760-763. doi:10.1016/j.jaad.2014.05.044
- Lee JH, Kim YJ, Kim J, et al. Erythema detection in digital skin images using CNN. Skin Res Technol. 2021;27(3):295-301. doi:10.1111/srt.12938
- Cho SB, Lee SJ, Chung WS, et al. Automated erythema detection and quantification in rosacea using deep learning. J Eur Acad Dermatol Venereol. 2021;35(4):965-972. doi:10.1111/jdv.17000
- Kim YJ, Park SH, Lee JH, et al. Automated erythema assessment using deep learning for sunscreen efficacy testing. Photodermatol Photoimmunol Photomed. 2023;39(2):135-142. doi:10.1111/phpp.12825
- Fredriksson T, Pettersson U. Severe psoriasis--oral therapy with a new retinoid. Dermatologica. 1978;157(4):238-244. doi:10.1159/000250839
- Langley RGB, Krueger GG, Griffiths CEM. Psoriasis: epidemiology, clinical features, and quality of life. Ann Rheum Dis. 2005;64(Suppl 2):ii18-ii23. doi:10.1136/ard.2004.033217
- Shen X, Zhang J, Yan C, Zhou H. An automatic diagnosis method of facial acne vulgaris based on convolutional neural network. Sci Rep. 2018;8(1):5839. doi:10.1038/s41598-018-24204-6
- Seité S, Khammari A, Benzaquen M, et al. Development and accuracy of an artificial intelligence algorithm for acne grading from smartphone photographs. Exp Dermatol. 2019;28(11):1252-1257. doi:10.1111/exd.14022
- Wu X, Wen N, Liang J, et al. Joint acne image grading and counting via label distribution learning. In: Proceedings of the IEEE/CVF International Conference on Computer Vision. 2019:10642-10651. doi:10.1109/ICCV.2019.01074
- Kimball AB, Kerdel F, Adams D, et al. Adalimumab for the treatment of moderate to severe hidradenitis suppurativa: a parallel randomized trial. Ann Intern Med. 2012;157(12):846-855. doi:10.7326/0003-4819-157-12-201212180-00004
- Olsen EA, Hordinsky MK, Price VH, et al. Alopecia areata investigational assessment guidelines--Part II. National Alopecia Areata Foundation. J Am Acad Dermatol. 2004;51(3):440-447. doi:10.1016/j.jaad.2003.09.032
- Lee Y, Lee SH, Kim YH, et al. Hair loss quantification from standardized scalp photographs using deep learning. J Invest Dermatol. 2022;142(6):1636-1643. doi:10.1016/j.jid.2021.10.031
- Messenger AG, McKillop J, Farrant P, McDonagh AJ, Sladden M. British Association of Dermatologists' guidelines for the management of alopecia areata 2012. Br J Dermatol. 2012;166(5):916-926. doi:10.1111/j.1365-2133.2012.10955.x
- Gardner SE, Frantz RA. Wound bioburden and infection-related complications in diabetic foot ulcers. Biol Res Nurs. 2008;10(1):44-53. doi:10.1177/1099800408319056
- Cutting KF, White RJ. Criteria for identifying wound infection--revisited. Ostomy Wound Manage. 2005;51(1):28-34.
- Rahma ON, Iyer R, Kattapuram T, et al. Objective assessment of perilesional erythema of chronic wounds using digital color image processing. Adv Skin Wound Care. 2015;28(1):11-16. doi:10.1097/01.ASW.0000459039.98700.74
- Schmitt J, Spuls PI, Thomas KS, et al. The Harmonising Outcome Measures for Eczema (HOME) statement to assess clinical signs of atopic eczema in trials. J Allergy Clin Immunol. 2014;134(4):800-807. doi:10.1016/j.jaci.2014.07.043
- Vakharia PP, Chopra R, Sacotte R, et al. Validation of patient-reported global severity of atopic dermatitis in adults. Allergy. 2018;73(2):451-458. doi:10.1111/all.13309
- Spuls PI, Lecluse LL, Poulsen ML, Bos JD, Stern RS, Nijsten T. How good are clinical severity and outcome measures for psoriasis?: quantitative evaluation in a systematic review. J Invest Dermatol. 2010;130(4):933-943. doi:10.1038/jid.2009.391
- Nast A, Jacobs A, Rosumeck S, Werner RN. Efficacy and safety of systemic long-term treatments for moderate-to-severe psoriasis: a systematic review and meta-analysis. J Invest Dermatol. 2015;135(11):2641-2648. doi:10.1038/jid.2015.206
- Esteva A, Chou K, Yeung S, et al. Deep learning-enabled medical computer vision. NPJ Digit Med. 2021;4(1):5. doi:10.1038/s41746-020-00376-2
- Thomsen K, Iversen L, Titlestad TL, Winther O. Systematic review of machine learning for diagnosis and prognosis in dermatology. J Dermatolog Treat. 2020;31(5):496-510. doi:10.1080/09546634.2019.1682500
- Młynek A, Zalewska-Janowska A, Martus P, Staubach P, Zuberbier T, Maurer M. How to assess disease activity in patients with chronic urticaria? Allergy. 2008;63(6):777-780. doi:10.1111/j.1398-9995.2008.01726.x
- Kinyanjui NM, Odongo T, Cintas C, et al. Estimating skin tone and effects on classification performance in dermatology datasets. arXiv preprint arXiv:1910.13268. 2019.
- Ezzedine K, Eleftheriadou V, Whitton M, van Geel N. Vitiligo. Lancet. 2015;386(9988):74-84. doi:10.1016/S0140-6736(14)60763-7
- Taylor SC, Arsonnaud S, Czernielewski J. The Taylor hyperpigmentation scale: a new visual assessment tool for the evaluation of skin color and pigmentation. Cutis. 2005;76(4):270-274.
- Del Bino S, Duval C, Bernerd F. Clinical and biological characterization of skin pigmentation diversity and its consequences on UV impact. Int J Mol Sci. 2018;19(9):2668. doi:10.3390/ijms19092668
- Ly BCK, Dyer EB, Feig JL, Chien AL, Del Bino S. Research Techniques Made Simple: Cutaneous Colorimetry: A Reliable Technique for Objective Skin Color Measurement. J Invest Dermatol. 2020;140(1):3-12.e1. doi:10.1016/j.jid.2019.11.003
- Tschandl P, Rosendahl C, Kittler H. The HAM10000 dataset, a large collection of multi-source dermatoscopic images of common pigmented skin lesions. Sci Data. 2018;5:180161. doi:10.1038/sdata.2018.161
- Winkler JK, Fink C, Toberer F, et al. Association between surgical skin markings in dermoscopic images and diagnostic performance of a deep learning convolutional neural network for melanoma recognition. JAMA Dermatol. 2019;155(10):1135-1141. doi:10.1001/jamadermatol.2019.1735
- Codella NCF, Gutman D, Celebi ME, et al. Skin lesion analysis toward melanoma detection: A challenge at the 2017 International symposium on biomedical imaging (ISBI), hosted by the international skin imaging collaboration (ISIC). In: 2018 IEEE 15th International Symposium on Biomedical Imaging (ISBI 2018). IEEE; 2018:168-172. doi:10.1109/ISBI.2018.8363547
- Fujisawa Y, Inoue S, Nakamura Y. The possibility of deep learning-based, computer-aided skin tumor classifiers. Front Med (Lausanne). 2019;6:191. doi:10.3389/fmed.2019.00191
- Jain A, Way D, Gupta V, et al. Development and assessment of an artificial intelligence-based tool for skin condition diagnosis by primary care physicians and nurse practitioners in teledermatology practices. JAMA Netw Open. 2021;4(4):e217249. doi:10.1001/jamanetworkopen.2021.7249
- Lee T, Ng V, Gallagher R, Coldman A, McLean D. Dullrazor: A software approach to hair removal from images. Comput Biol Med. 1997;27(6):533-543. doi:10.1016/s0010-4825(97)00020-6
- Winkler JK, Sies K, Fink C, et al. Melanoma recognition by a deep learning convolutional neural network-Performance in different melanoma subtypes and localisations. Eur J Cancer. 2020;127:21-29. doi:10.1016/j.ejca.2019.11.020
- Chakravorty R, Abedini M, Halpern A, et al. Dermoscopic image segmentation using deep convolutional networks. In: 2017 39th Annual International Conference of the IEEE Engineering in Medicine and Biology Society (EMBC). IEEE; 2017:542-545. doi:10.1109/EMBC.2017.8036895
- Bi L, Kim J, Ahn E, Kumar A, Fulham M, Feng D. Dermoscopic image segmentation via multistage fully convolutional networks. IEEE Trans Biomed Eng. 2017;64(9):2065-2074. doi:10.1109/TBME.2017.2712771
- Celebi ME, Wen Q, Iyatomi H, Shimizu K, Zhou H, Schaefer G. A state-of-the-art survey on lesion border detection in dermoscopy images. Dermoscopy Image Analysis. 2015:97-129. doi:10.1201/b19107-5
- Yuan Y, Chao M, Lo YC. Automatic skin lesion segmentation using deep fully convolutional networks with Jaccard distance. IEEE Trans Med Imaging. 2017;36(9):1876-1886. doi:10.1109/TMI.2017.2695227
- Mirikharaji Z, Abhishek K, Izadi S, Hamarneh G. Star shape prior in fully convolutional networks for skin lesion segmentation. In: Medical Image Computing and Computer Assisted Intervention – MICCAI 2018. Springer; 2018:737-745. doi:10.1007/978-3-030-00937-3_84
- Barata C, Ruela M, Francisco M, Mendonça T, Marques JS. Two systems for the detection of melanomas in dermoscopy images using texture and color features. IEEE Syst J. 2014;8(3):965-979. doi:10.1109/JSYST.2013.2271540
- Marchetti MA, Codella NCF, Dusza SW, et al. Results of the 2016 International Skin Imaging Collaboration International Symposium on Biomedical Imaging challenge: Comparison of the accuracy of computer algorithms to dermatologists for the diagnosis of melanoma from dermoscopic images. J Am Acad Dermatol. 2018;78(2):270-277.e1. doi:10.1016/j.jaad.2017.08.016
- Stern RS, Nijsten T, Feldman SR, Margolis DJ, Rolstad T. Psoriasis is common, carries a substantial burden even when not extensive, and is associated with widespread treatment dissatisfaction. J Investig Dermatol Symp Proc. 2004;9(2):136-139. doi:10.1046/j.1087-0024.2003.09102.x
- Jaspers S, Hopermann S, Sauermann G, et al. Rapid in vivo measurement of the topography of human skin by active image triangulation using a digital micromirror device. Skin Res Technol. 1999;5(3):195-207. doi:10.1111/j.1600-0846.1999.tb00131.x
- Takeshita J, Gelfand JM, Li P, et al. Psoriasis in the U.S. Medicare population: prevalence, treatment, and factors associated with biologic use. J Invest Dermatol. 2015;135(12):2955-2963. doi:10.1038/jid.2015.296
- Parisi R, Symmons DP, Griffiths CE, Ashcroft DM. Global epidemiology of psoriasis: a systematic review of incidence and prevalence. J Invest Dermatol. 2013;133(2):377-385. doi:10.1038/jid.2012.339
- Menter A, Strober BE, Kaplan DH, et al. Joint AAD-NPF guidelines of care for the management and treatment of psoriasis with biologics. J Am Acad Dermatol. 2019;80(4):1029-1072. doi:10.1016/j.jaad.2018.11.057
- Zaenglein AL, Pathy AL, Schlosser BJ, et al. Guidelines of care for the management of acne vulgaris. J Am Acad Dermatol. 2016;74(5):945-973.e33. doi:10.1016/j.jaad.2015.12.037
- Jemec GB. Clinical practice. Hidradenitis suppurativa. N Engl J Med. 2012;366(2):158-164. doi:10.1056/NEJMcp1014163
- Bradford PT, Goldstein AM, McMaster ML, Tucker MA. Acral lentiginous melanoma: incidence and survival patterns in the United States, 1986-2005. Arch Dermatol. 2009;145(4):427-434. doi:10.1001/archdermatol.2008.609
- Kawahara J, BenTaieb A, Hamarneh G. Deep features to classify skin lesions. In: 2016 IEEE 13th International Symposium on Biomedical Imaging (ISBI). IEEE; 2016:1397-1400. doi:10.1109/ISBI.2016.7493528
- Robinson A, Kardos M, Kimball AB. Physician Global Assessment (PGA) and Psoriasis Area and Severity Index (PASI): why do both? A systematic analysis of randomized controlled trials of biologic agents for moderate to severe plaque psoriasis. J Am Acad Dermatol. 2012;66(3):369-375. doi:10.1016/j.jaad.2011.01.022
- Yentzer BA, Ade RA, Fountain JM, et al. Simplifying regimens promotes greater adherence and outcomes with topical acne medications: a randomized controlled trial. Cutis. 2010;86(2):103-108.
- Rademaker M, Agnew K, Anagnostou N, et al. Psoriasis in those planning a family, pregnant or breastfeeding. The Australasian Psoriasis Collaboration. Australas J Dermatol. 2018;59(2):86-100. doi:10.1111/ajd.12733
- Brown BC, McKenna SP, Siddhi K, McGrouther DA, Bayat A. The hidden cost of skin scars: quality of life after skin scarring. J Plast Reconstr Aesthet Surg. 2008;61(9):1049-1058. doi:10.1016/j.bjps.2008.03.020
- Rennekampff HO, Hansbrough JF, Kiessig V, Doré C, Stoutenbeek CP, Schröder-Printzen I. Bioactive interleukin-8 is expressed in wounds and enhances wound healing. J Surg Res. 2000;93(1):41-54. doi:10.1006/jsre.2000.5892
- Wachtel TL, Berry CC, Wachtel EE, Frank HA. The inter-rater reliability of estimating the size of burns from various burn area chart drawings. Burns. 2000;26(2):156-170. doi:10.1016/s0305-4179(99)00047-9
- van Baar ME, Essink-Bot ML, Oen IM, Dokter J, Boxma H, van Beeck EF. Functional outcome after burns: a review. Burns. 2006;32(1):1-9. doi:10.1016/j.burns.2005.08.007
- Shuster S, Black MM, McVitie E. The influence of age and sex on skin thickness, skin collagen and density. Br J Dermatol. 1975;93(6):639-643. doi:10.1111/j.1365-2133.1975.tb05113.x
- Lucas C, Stanborough RW, Freeman CL, De Haan RJ. Efficacy of low-level laser therapy on wound healing in human subjects: a systematic review. Lasers Med Sci. 2000;15(2):84-93. doi:10.1007/s101030050053
- Mayrovitz HN, Soontupe LB. Wound areas by computerized planimetry of digital images: accuracy and reliability. Adv Skin Wound Care. 2009;22(5):222-229. doi:10.1097/01.ASW.0000305410.58350.36
- Wannous H, Lucas Y, Treuillet S, Albouy B. Supervised tissue classification from color images for a complete wound assessment tool. In: 2007 29th Annual International Conference of the IEEE Engineering in Medicine and Biology Society. IEEE; 2007:6031-6034. doi:10.1109/IEMBS.2007.4353725
- Spilsbury K, Semmens JB, Saunders CM, Hall SE. Long-term survival outcomes following breast-conserving surgery with and without radiotherapy for invasive breast cancer. ANZ J Surg. 2005;75(5):337-342. doi:10.1111/j.1445-2197.2005.03374.x
- Draaijers LJ, Tempelman FR, Botman YA, et al. The patient and observer scar assessment scale: a reliable and feasible tool for scar evaluation. Plast Reconstr Surg. 2004;113(7):1960-1965. doi:10.1097/01.prs.0000122207.28773.56
- Lebwohl M, Yeilding N, Szapary P, et al. Impact of weight on the efficacy and safety of ustekinumab in patients with moderate to severe psoriasis: rationale for dosing recommendations. J Am Acad Dermatol. 2010;63(4):571-579. doi:10.1016/j.jaad.2009.11.012
- Hanifin JM, Thurston M, Omoto M, Cherill R, Tofte SJ, Graeber M. The eczema area and severity index (EASI): assessment of reliability in atopic dermatitis. EASI Evaluator Group. Exp Dermatol. 2001;10(1):11-18. doi:10.1034/j.1600-0625.2001.100102.x
- Thomas CL, Finlay KA. Defining the boundaries: a critical evaluation of the Birmingham Burn Unit body map. Burns. 1986;12(8):544-548. doi:10.1016/0305-4179(86)90188-1
- Berkley JL. Determining total body surface area of a burn using a Lund and Browder chart. Nursing. 2007;37(10):18. doi:10.1097/01.NURSE.0000296227.88874.9e
- Langley RG, Ellis CN. Evaluating psoriasis with Psoriasis Area and Severity Index, Psoriasis Global Assessment, and Lattice System Physician's Global Assessment. J Am Acad Dermatol. 2004;51(4):563-569. doi:10.1016/j.jaad.2004.04.012
- Finlay AY. Current severe psoriasis and the rule of tens. Br J Dermatol. 2005;152(5):861-867. doi:10.1111/j.1365-2133.2005.06502.x
- Gudi V, Akhondi H. Burn Surface Area Assessment. In: StatPearls. Treasure Island (FL): StatPearls Publishing; 2023.
- Hawro T, Ohanyan T, Schoepke N, et al. The urticaria activity score—validity, reliability, and responsiveness. J Allergy Clin Immunol Pract. 2018;6(4):1185-1190.e1. doi:10.1016/j.jacp.2017.10.001
- Maurer M, Weller K, Bindslev-Jensen C, et al. Unmet clinical needs in chronic spontaneous urticaria. A GA²LEN task force report. Allergy. 2011;66(3):317-330. doi:10.1111/j.1398-9995.2010.02496.x
- Han SS, Moon IJ, Lim W, et al. Keratinocytic skin cancer detection on the face using region-based convolutional neural network. JAMA Dermatol. 2020;156(1):29-37. doi:10.1001/jamadermatol.2019.3807
- Zuberbier T, Balke M, Worm M, Edenharter G, Maurer M. Epidemiology of urticaria: a representative cross-sectional population survey. Clin Exp Dermatol. 2010;35(8):869-873. doi:10.1111/j.1365-2230.2010.03840.x
- Mathias SD, Dreskin SC, Kaplan A, Saini SS, Rosén K, Beck LA. Development of a daily diary for patients with chronic idiopathic urticaria. Ann Allergy Asthma Immunol. 2010;105(2):142-148. doi:10.1016/j.anai.2010.06.011
- Olsen EA, Dunlap FE, Funicella T, et al. A randomized clinical trial of 5% topical minoxidil versus 2% topical minoxidil and placebo in the treatment of androgenetic alopecia in men. J Am Acad Dermatol. 2002;47(3):377-385. doi:10.1067/mjd.2002.124088
- Alkhalifah A, Alsantali A, Wang E, McElwee KJ, Shapiro J. Alopecia areata update: part I. Clinical picture, histopathology, and pathogenesis. J Am Acad Dermatol. 2010;62(2):177-188. doi:10.1016/j.jaad.2009.10.032
- Rich P, Scher RK. Nail Psoriasis Severity Index: a useful tool for evaluation of nail psoriasis. J Am Acad Dermatol. 2003;49(2):206-212. doi:10.1067/s0190-9622(03)00910-1
- Fernández-Nieto D, Cura-Gonzalez ID, Esteban-Velasco C, Marques-Mejias MA, Ortega-Quijano D. Artificial intelligence to assess nail unit disorders: A pilot study. Skin Appendage Disord. 2021;7(6):428-433. doi:10.1159/000517341
- Parrish CA, Sobera JO, Elewski BE. Modification of the Nail Psoriasis Severity Index. J Am Acad Dermatol. 2005;53(4):745-746. doi:10.1016/j.jaad.2005.04.028
- Antonini D, Simonatto M, Candi E, Melino G. Keratinocyte stem cells and their niches in the skin appendages. J Invest Dermatol. 2014;134(7):1797-1799. doi:10.1038/jid.2014.126
- Njoo MD, Westerhof W, Bos JD, Bossuyt PM. A systematic review of autologous transplantation methods in vitiligo. Arch Dermatol. 1998;134(12):1543-1549. doi:10.1001/archderm.134.12.1543
- Grimes PE, Miller MM. Vitiligo: Patient stories, self-esteem, and the psychological burden of disease. Int J Womens Dermatol. 2018;4(1):32-37. doi:10.1016/j.ijwd.2017.11.005
- Hamzavi I, Jain H, McLean D, Shapiro J, Zeng H, Lui H. Parametric modeling of narrowband UV-B phototherapy for vitiligo using a novel quantitative tool: the Vitiligo Area Scoring Index. Arch Dermatol. 2004;140(6):677-683. doi:10.1001/archderm.140.6.677
- Njoo MD, Vodegel RM, Westerhof W. Depigmentation therapy in vitiligo universalis with topical 4-methoxyphenol and the Q-switched ruby laser. J Am Acad Dermatol. 2000;42(5 Pt 1):760-769. doi:10.1016/s0190-9622(00)90009-x
- Parsad D, Pandhi R, Dogra S, Kumar B. Clinical study of repigmentation patterns with different treatment modalities and their correlation with speed and stability of repigmentation in 352 vitiliginous patches. J Am Acad Dermatol. 2004;50(1):63-67. doi:10.1016/s0190-9622(03)02463-4
- Rodrigues M, Ezzedine K, Hamzavi I, Pandya AG, Harris JE. New discoveries in the pathogenesis and classification of vitiligo. J Am Acad Dermatol. 2017;77(1):1-13. doi:10.1016/j.jaad.2016.10.048
- Passeron T, Ortonne JP. Use of the 308-nm excimer laser for psoriasis and vitiligo. Clin Dermatol. 2006;24(1):33-42. doi:10.1016/j.clindermatol.2005.10.018
- Gawkrodger DJ, Ormerod AD, Shaw L, et al. Guideline for the diagnosis and management of vitiligo. Br J Dermatol. 2008;159(5):1051-1076. doi:10.1111/j.1365-2133.2008.08881.x
- Halder RM, Taliaferro SJ. Vitiligo. In: Wolff K, Goldsmith LA, Katz SI, et al, eds. Fitzpatrick's Dermatology in General Medicine. 7th ed. McGraw-Hill; 2008:616-622.
- Tan JK, Tang J, Fung K, et al. Development and validation of a comprehensive acne severity scale. J Cutan Med Surg. 2007;11(6):211-216. doi:10.2310/7750.2007.00037
- Layton AM, Henderson CA, Cunliffe WJ. A clinical evaluation of acne scarring and its incidence. Clin Exp Dermatol. 1994;19(4):303-308. doi:10.1111/j.1365-2230.1994.tb01200.x
- Tan J, Thiboutot D, Popp G, et al. Randomized phase 3 evaluation of trifarotene 50 μg/g cream treatment of moderate facial and truncal acne. J Am Acad Dermatol. 2019;80(6):1691-1699. doi:10.1016/j.jaad.2019.02.044
- Leyden J, Stein-Gold L, Weiss J. Why topical retinoids are mainstay of therapy for acne. Dermatol Ther (Heidelb). 2017;7(3):293-304. doi:10.1007/s13555-017-0185-2
- Thiboutot DM, Dréno B, Abanmi A, et al. Practical management of acne for clinicians: An international consensus from the Global Alliance to Improve Outcomes in Acne. J Am Acad Dermatol. 2018;78(2 Suppl 1):S1-S23.e1. doi:10.1016/j.jaad.2017.09.078
- Seité S, Dréno B, Benech F, Bédane C, Pecastaings S. Creation and validation of an artificial intelligence algorithm for acne grading. J Eur Acad Dermatol Venereol. 2020;34(12):2946-2951. doi:10.1111/jdv.16736
- Winkler JK, Sies K, Fink C, et al. Association between different scale bars in dermoscopic images and diagnostic performance of a market-approved deep learning convolutional neural network for melanoma recognition. Eur J Cancer. 2021;145:146-154. doi:10.1016/j.ejca.2020.12.010
- Burlina P, Joshi N, Ng E, Billings S, Paul W, Rotemberg V. Assessment of deep generative models for high-resolution synthetic retinal image generation of age-related macular degeneration. JAMA Ophthalmol. 2019;137(3):258-264. doi:10.1001/jamaophthalmol.2018.6156
- Korotkov K, Garcia R. Computerized analysis of pigmented skin lesions: A review. Artif Intell Med. 2012;56(2):69-90. doi:10.1016/j.artmed.2012.08.002
- Brinker TJ, Hekler A, Hauschild A, et al. Comparing artificial intelligence algorithms to 157 German dermatologists: the melanoma classification benchmark. Eur J Cancer. 2019;111:30-37. doi:10.1016/j.ejca.2018.12.016
- Perednia DA, Brown NA. Teledermatology: one application of telemedicine. Bull Med Libr Assoc. 1995;83(1):42-47.
- Ngoo A, Finnane A, McMeniman E, Tan JM, Janda M, Soyer HP. Fighting melanoma with smartphones: A snapshot on where we are a decade after app stores opened their doors. Int J Med Inform. 2018;118:99-112. doi:10.1016/j.ijmedinf.2018.08.004
- Kroemer S, Frühauf J, Campbell TM, et al. Mobile teledermatology for skin tumour screening: diagnostic accuracy of clinical and dermoscopic image tele-evaluation using cellular phones. Br J Dermatol. 2011;164(5):973-979. doi:10.1111/j.1365-2133.2011.10208.x
- Massone C, Hofmann-Wellenhof R, Ahlgrimm-Siess V, Gabler G, Ebner C, Soyer HP. Melanoma screening with cellular phones. PLoS One. 2007;2(5):e483. doi:10.1371/journal.pone.0000483
- Ferrara G, Argenziano G, Soyer HP, et al. The influence of clinical information in the histopathologic diagnosis of melanocytic skin neoplasms. PLoS One. 2009;4(4):e5375. doi:10.1371/journal.pone.0005375
- Carli P, De Giorgi V, Crocetti E, et al. Improvement of malignant/benign ratio in excised melanocytic lesions in the 'dermoscopy era': a retrospective study 1997-2001. Br J Dermatol. 2004;150(4):687-692. doi:10.1111/j.0007-0963.2004.05860.x
- Del Bino S, Bernerd F. Variations in skin colour and the biological consequences of ultraviolet radiation exposure. Br J Dermatol. 2013;169(Suppl 3):33-40. doi:10.1111/bjd.12529
- Pershing S, Enns JT, Bae IS, Randall BD, Pruiksma JB, Desai AD. Variability in physician assessment of oculoplastic standardized photographs. Aesthet Surg J. 2014;34(8):1203-1209. doi:10.1177/1090820X14542642
- Goh CL. The need for evidence-based aesthetic dermatology practice. J Cutan Aesthet Surg. 2009;2(2):65-71. doi:10.4103/0974-2077.58518
- Lester JC, Jia JL, Zhang L, Okoye GA, Linos E. Absence of images of skin of colour in publications of COVID-19 skin manifestations. Br J Dermatol. 2020;183(3):593-595. doi:10.1111/bjd.19258
- Wagner JK, Jovel C, Norton HL, Parra EJ, Shriver MD. Comparing quantitative measures of erythema, pigmentation and skin response using reflectometry. Pigment Cell Res. 2002;15(5):379-384. doi:10.1034/j.1600-0749.2002.02042.x
- Nkengne A, Bertin C, Stamatas GN, et al. Influence of facial skin attributes on the perceived age of Caucasian women. J Eur Acad Dermatol Venereol. 2008;22(8):982-991. doi:10.1111/j.1468-3083.2008.02698.x
- Davenport T, Kalakota R. The potential for artificial intelligence in healthcare. Future Healthc J. 2019;6(2):94-98. doi:10.7861/futurehosp.6-2-94
- Char DS, Shah NH, Magnus D. Implementing machine learning in health care - addressing ethical challenges. N Engl J Med. 2018;378(11):981-983. doi:10.1056/NEJMp1714229
- Gichoya JW, Banerjee I, Bhimireddy AR, et al. AI recognition of patient race in medical imaging: a modelling study. Lancet Digit Health. 2022;4(6):e406-e414. doi:10.1016/S2589-7500(22)00063-2
- Alexis AF, Sergay AB, Taylor SC. Common dermatologic disorders in skin of color: a comparative practice survey. Cutis. 2007;80(5):387-394.
- Ebede TL, Arch EL, Berson D. Hormonal treatment of acne in women. J Clin Aesthet Dermatol. 2009;2(12):16-22.
- Ly BC, Dyer EB, Feig JL, Chien AL, Del Bino S. Research Techniques Made Simple: Cutaneous Colorimetry: A Reliable Technique for Objective Skin Color Measurement. J Invest Dermatol. 2020;140(1):3-12.e1. doi:10.1016/j.jid.2019.11.003
- Chardon A, Cretois I, Hourseau C. Skin colour typology and suntanning pathways. Int J Cosmet Sci. 1991;13(4):191-208. doi:10.1111/j.1467-2494.1991.tb00561.x
- Gareau DS. Feasibility of digitally stained multimodal confocal mosaics to simulate histopathology. J Biomed Opt. 2009;14(3):034050. doi:10.1117/1.3149853
- Koenig K, Raphael AP, Lin L, et al. Optical skin biopsies by clinical CARS and multiphoton fluorescence/SHG tomography. Laser Phys Lett. 2011;8(6):465-468. doi:10.1002/lapl.201110014
- Baldi A, Murace R, Dragonetti E, et al. The Significance of Artificial Intelligence in the Assessment of Skin Cancer. J Clin Med. 2021;10(21):4926. doi:10.3390/jcm10214926
- Esteva A, Robicquet A, Ramsundar B, et al. A guide to deep learning in healthcare. Nat Med. 2019;25(1):24-29. doi:10.1038/s41591-018-0316-z
- Winkler JK, Fink C, Toberer F, et al. Association between surgical skin markings in dermoscopic images and diagnostic performance of a deep learning convolutional neural network for melanoma recognition. JAMA Dermatol. 2019;155(10):1135-1141. doi:10.1001/jamadermatol.2019.1735
- Kittler H, Pehamberger H, Wolff K, Binder M. Diagnostic accuracy of dermoscopy. Lancet Oncol. 2002;3(3):159-165. doi:10.1016/s1470-2045(02)00679-4
- Beam AL, Kohane IS. Big data and machine learning in health care. JAMA. 2018;319(13):1317-1318. doi:10.1001/jama.2017.18391
- Codella NC, Lin CC, Halpern A, et al. Collaborative human-AI (CHAI): Evidence-based interpretable melanoma classification in dermoscopic images. In: Understanding and Interpreting Machine Learning in Medical Image Computing Applications. Springer; 2018:97-105. doi:10.1007/978-3-030-02628-8_11
- Zouboulis CC, Desai N, Emtestam L, et al. European S1 guideline for the treatment of hidradenitis suppurativa/acne inversa. J Eur Acad Dermatol Venereol. 2015;29(4):619-644. doi:10.1111/jdv.12966
- Martorell A, García-Martínez FJ, Jiménez-Gallo D, et al. An update on hidradenitis suppurativa (Part I): Epidemiology, clinical aspects, and definition of disease severity. Actas Dermosifiliogr. 2015;106(9):703-715. doi:10.1016/j.ad.2015.06.004
- Hurley HJ. Axillary hyperhidrosis, apocrine bromhidrosis, hidradenitis suppurativa, and familial benign pemphigus: surgical approach. In: Roenigk RK, Roenigk HH Jr, eds. Dermatologic Surgery: Principles and Practice. Marcel Dekker; 1989:623-645.
- Revuz JE, Canoui-Poitrine F, Wolkenstein P, et al. Prevalence and factors associated with hidradenitis suppurativa: results from two case-control studies. J Am Acad Dermatol. 2008;59(4):596-601. doi:10.1016/j.jaad.2008.06.020
- Alikhan A, Sayed C, Alavi A, et al. North American clinical management guidelines for hidradenitis suppurativa: A publication from the United States and Canadian Hidradenitis Suppurativa Foundations: Part I: Diagnosis, evaluation, and the use of complementary and procedural management. J Am Acad Dermatol. 2019;81(1):76-90. doi:10.1016/j.jaad.2019.02.067
- Ingram JR, Collier F, Brown D, et al. British Association of Dermatologists guidelines for the management of hidradenitis suppurativa (acne inversa) 2018. Br J Dermatol. 2019;180(5):1009-1017. doi:10.1111/bjd.17537
- Esmann S, Jemec GB. Psychosocial impact of hidradenitis suppurativa: a qualitative study. Acta Derm Venereol. 2011;91(3):328-332. doi:10.2340/00015555-1082
- Matusiak Ł, Bieniek A, Szepietowski JC. Increased serum tumour necrosis factor-α in hidradenitis suppurativa patients: is there a basis for treatment with anti-tumour necrosis factor-α agents? Acta Derm Venereol. 2009;89(6):601-603. doi:10.2340/00015555-0701
- Grant A, Gonzalez T, Montgomery MO, Cardenas V, Kerdel FA. Infliximab therapy for patients with moderate to severe hidradenitis suppurativa: a randomized, double-blind, placebo-controlled crossover trial. J Am Acad Dermatol. 2010;62(2):205-217. doi:10.1016/j.jaad.2009.06.050
- Schneider-Burrus S, Tsaousi A, Barbus S, Huss-Marp J, Witte-Händel E, Witte K. Features associated with quality of life impairment in hidradenitis suppurativa patients. Front Med (Lausanne). 2021;8:676241. doi:10.3389/fmed.2021.676241
- Moriarty B, Jiyad Z, Creamer D. Four-weekly infliximab in the treatment of severe hidradenitis suppurativa. Br J Dermatol. 2014;170(4):986-987. doi:10.1111/bjd.12823
- Vossen ARJV, van der Zee HH, Prens EP. Hidradenitis Suppurativa: A Systematic Review Integrating Inflammatory Pathways Into a Cohesive Pathogenic Model. Front Immunol. 2018;9:2965. doi:10.3389/fimmu.2018.02965
- Sabat R, Jemec GBE, Matusiak Ł, Kimball AB, Prens E, Wolk K. Hidradenitis suppurativa. Nat Rev Dis Primers. 2020;6(1):18. doi:10.1038/s41572-020-0149-1
- Kimball AB, Kerdel F, Adams D, et al. Adalimumab for the treatment of moderate to severe hidradenitis suppurativa: a parallel randomized trial. Ann Intern Med. 2012;157(12):846-855. doi:10.7326/0003-4819-157-12-201212180-00004
- Zouboulis CC, Tzellos T, Kyrgidis A, et al. Development and validation of the International Hidradenitis Suppurativa Severity Score System (IHS4), a novel dynamic scoring system to assess HS severity. Br J Dermatol. 2017;177(5):1401-1409. doi:10.1111/bjd.15748
- Kimball AB, Okun MM, Williams DA, et al. Two Phase 3 Trials of Adalimumab for Hidradenitis Suppurativa. N Engl J Med. 2016;375(5):422-434. doi:10.1056/NEJMoa1504370
- Jfri A, Nassim D, O'Brien E, Gulliver W, Nikolakis G, Zouboulis CC. Prevalence of Hidradenitis Suppurativa: A Systematic Review and Meta-regression Analysis. JAMA Dermatol. 2021;157(8):924-931. doi:10.1001/jamadermatol.2021.1677
- Gomolin A, Cline A, Russo S, Wirya SA, Treat JR. Treatment of inflammatory manifestations of hidradenitis suppurativa with secukinumab in pediatric patients. JAAD Case Rep. 2019;5(12):1088-1091. doi:10.1016/j.jdcr.2019.10.005
- Mehdizadeh A, Hazen PG, Bechara FG, et al. Recurrence of hidradenitis suppurativa after surgical management: A systematic review and meta-analysis. J Am Acad Dermatol. 2015;73(5 Suppl 1):S70-S77. doi:10.1016/j.jaad.2015.07.044
- Goyal M, Knackstedt T, Yan S, Hassanpour S. Artificial intelligence-based image classification methods for diagnosis of skin cancer: Challenges and opportunities. Comput Biol Med. 2020;127:104065. doi:10.1016/j.compbiomed.2020.104065
- Nasr-Esfahani E, Samavi S, Karimi N, et al. Melanoma detection by analysis of clinical images using convolutional neural network. Annu Int Conf IEEE Eng Med Biol Soc. 2016;2016:1373-1376. doi:10.1109/EMBC.2016.7590963
- Garnavi R, Aldeen M, Celebi ME, Varigos G, Finch S. Border detection in dermoscopy images using hybrid thresholding on optimized color channels. Comput Med Imaging Graph. 2011;35(2):105-115. doi:10.1016/j.compmedimag.2010.08.001
- Xie Y, Zhang J, Xia Y. Semi-supervised adversarial model for benign-malignant lung nodule classification on chest CT. Med Image Anal. 2019;57:237-248. doi:10.1016/j.media.2019.07.004
- Serte S, Serener A, Al-Turjman F. Deep learning in medical imaging: A brief review. Trans Emerg Telecommun Technol. 2020;e4080. doi:10.1002/ett.4080
- Lee H, Chen YP. Image based computer aided diagnosis system for cancer detection. Expert Syst Appl. 2015;42(12):5356-5365. doi:10.1016/j.eswa.2015.02.005
- Udrea A, Mitra GD, Costea D, et al. Accuracy of a smartphone application for triage of skin lesions based on machine learning algorithms. J Eur Acad Dermatol Venereol. 2020;34(3):648-655. doi:10.1111/jdv.15935
- Schmid-Saugeón P, Guillod J, Thiran JP. Towards a computer-aided diagnosis system for pigmented skin lesions. Comput Med Imaging Graph. 2003;27(1):65-78. doi:10.1016/s0895-6111(02)00048-4
- Kasmi R, Mokrani K. Classification of malignant melanoma and benign skin lesions: implementation of automatic ABCD rule. IET Image Process. 2016;10(6):448-455. doi:10.1049/iet-ipr.2015.0385
- Jemec GB, Heidenheim M, Nielsen NH. The prevalence of hidradenitis suppurativa and its potential precursor lesions. J Am Acad Dermatol. 1996;35(2 Pt 1):191-194. doi:10.1016/s0190-9622(96)90321-7
- Yanling LI, Adams Wai-Kin Kong, Steven Thng. Segmenting vitiligo on clinical face images using CNN trained on synthetic and internet images. IEEE Journal of Biomedical and Health Informatics. 2021;25(8):3082-3093. doi:10.1109/JBHI.2021.3063388
- Guo L, et al. A deep learning-based hybrid artificial intelligence model for the detection and severity assessment of vitiligo lesions. Ann Transl Med. 2022;10(10):590. doi:10.21037/atm-22-1738
- Lu J, et al. Automatic segmentation of scaling in 2-D psoriasis skin images. IEEE Trans Med Imaging. 2012;32(4):719-730. doi:10.1109/TMI.2012.2236349
- Hashemifard K, Florez-Revuelta F. From garment to skin: the visuaal skin segmentation dataset. InInternational conference on image analysis and processing 2022 May 23 (pp. 59-70). Cham: Springer International Publishing.
- Olsen EA, Hordinsky MK, Price VH, Roberts JL, Shapiro J, Canfield D, Duvic M, King LE, McMichael AJ, Randall VA, Turner ML. Alopecia areata investigational assessment guidelines–Part II. Journal of the American Academy of Dermatology. 2004 Sep 1;51(3):440-7.
- Dash, Manoranjan, et al. "PsLSNet: Automated psoriasis skin lesion segmentation using modified U-Net-based fully convolutional network." Biomedical Signal Processing and Control 52 (2019): 226-237.
- Raj, Ritesh, Narendra D. Londhe, and Rajendra Sonawane. "Automated psoriasis lesion segmentation from unconstrained environment using residual U-Net with transfer learning." Computer Methods and Programs in Biomedicine 206 (2021): 106123.
- Scebba, Gaetano, et al. "Detect-and-segment: A deep learning approach to automate wound image segmentation." Informatics in Medicine Unlocked 29 (2022): 100884.
- Lee, Solam, et al. "Clinically applicable deep learning framework for measurement of the extent of hair loss in patients with alopecia areata." JAMA dermatology 156.9 (2020): 1018-1020.
- Gudobba, Cameron, et al. "Automating hair loss labels for universally scoring alopecia from images: rethinking alopecia scores." JAMA dermatology 159.2 (2023): 143-150.
- Xu, Rongtao, et al. "Skinformer: Learning statistical texture representation with transformer for skin lesion segmentation." IEEE Journal of Biomedical and Health Informatics 28.10 (2024): 6008-6018.
- L.-C. Chen, Y. Zhu, G. Papandreou, F. Schroff, and H. Adam, “Encoder- decoder with atrous separable convolution for semantic image segmen- tation,” in Proceedings of the European conference on computer vision (ECCV), 2018, pp. 801–818.
- Z. Zhou, M. M. Rahman Siddiquee, N. Tajbakhsh, and J. Liang, “Unet++: A nested u-net architecture for medical image segmentation,” in Deep learning in medical image analysis and multimodal learning for clinical decision support. Springer, 2018, pp. 3–11.
- Z. Gu, J. Cheng, H. Fu, K. Zhou, H. Hao, Y. Zhao, T. Zhang, S. Gao, and J. Liu, “Ce-net: Context encoder network for 2d medical image segmentation,” IEEE Transactions on Medical Imaging, vol. 38, no. 10, pp. 2281–2292, 2019.
- J. M. J. Valanarasu, P. Oza, I. Hacihaliloglu, and V. M. Patel, “Medical transformer: Gated axial-attention for medical image segmentation,” in International Conference on Medical Image Computing and Computer- Assisted Intervention. Springer, 2021, pp. 36–46.
- Y. Ji, R. Zhang, H. Wang, Z. Li, L. Wu, S. Zhang, and P. Luo, “Multi- compound transformer for accurate biomedical image segmentation,” in International Conference on Medical Image Computing and Computer- Assisted Intervention. Springer, 2021, pp. 326–336.
- R. Xu, C. Wang, S. Xu, W. Meng, and X. Zhang, “Dc-net: Dual context network for 2d medical image segmentation,” in International Confer- ence on Medical Image Computing and Computer-Assisted Intervention. Springer, 2021, pp. 503–513.
- J. Wang, L. Wei, L. Wang, Q. Zhou, L. Zhu, and J. Qin, “Boundary- aware transformers for skin lesion segmentation,” in International Con- ference on Medical Image Computing and Computer-Assisted Interven- tion. Springer, 2021, pp. 206–216.
- E. Tartaglione, A. Bragagnolo, A. Fiandrotti, and M. Grangetto, “Loss- based sensitivity regularization: towards deep sparse neural networks,” Neural Networks, vol. 146, pp. 230–237, 2022.
- D. Dai, C. Dong, S. Xu, Q. Yan, Z. Li, C. Zhang, and N. Luo, “Ms red: A novel multi-scale residual encoding and decoding network for skin lesion segmentation,” Medical Image Analysis, vol. 75, p. 102293, 2022.
- E. K. Aghdam, R. Azad, M. Zarvani, and D. Merhof, “Attention swin u- net: Cross-contextual attention mechanism for skin lesion segmentation,” in 2023 IEEE 20th International Symposium on Biomedical Imaging (ISBI). IEEE, 2023, pp. 1–5.
- Hashemifard K, Florez-Revuelta F. From garment to skin: the visuaal skin segmentation dataset. InInternational conference on image analysis and processing 2022 May 23 (pp. 59-70). Cham: Springer International Publishing.
- Huang, G.; Liu, Z.; Van Der Maaten, L.; Weinberger, K.Q. Densely connected convolutional network. In Proceedings of the IEEE Conference on Computer Vision and Pattern Recognition, Honolulu, HI, USA, 21–26 July 2017
- Abubaker M, Alsadder Z, Abdelhaq H, Boltes M, Alia A. RPEE-Heads Benchmark: A Dataset and Empirical Comparison of Deep Learning Algorithms for Pedestrian Head Detection in Crowds. IEEE Access. 2025 Apr 22.
- Al-Hamadani S. Intelligent Healthcare Imaging Platform: A VLM-Based Framework for Automated Medical Image Analysis and Clinical Report Generation. arXiv preprint arXiv:2509.13590. 2025 Sep 16.
- Fagertun J, Harder S, Rosengren A, Moeller C, Werge T, Paulsen RR, Hansen TF. 3D facial landmarks: Inter-operator variability of manual annotation. BMC medical imaging. 2014 Oct 11;14(1):35.
- Hammadi Y, Grondin F, Ferland F, Lebel K. Evaluation of various state of the art head pose estimation algorithms for clinical scenarios. Sensors. 2022 Sep 10;22(18):6850.
- Huynh QT, Nguyen PH, Le HX, Ngo LT, Trinh NT, Tran MT, Nguyen HT, Vu NT, Nguyen AT, Suda K, Tsuji K. Automatic acne object detection and acne severity grading using smartphone images and artificial intelligence. Diagnostics. 2022 Aug 3;12(8):1879.
- Mac Carthy T, Montilla IH, Aguilar A, Castro RG, Pérez AM, Sueiro AV, de la Campa LV, Alfageme F, Medela A. Automatic Urticaria Activity Score: Deep Learning–Based Automatic Hive Counting for Urticaria Severity Assessment. JID Innovations. 2024 Jan 1;4(1):100218.
- Min S, Kong HJ, Yoon C, Kim HC, Suh DH. Development and evaluation of an automatic acne lesion detection program using digital image processing. Skin Research and Technology. 2013 Feb;19(1):e423-32.
- Ovadja ZN, Schuit MM, van der Horst CM, Lapid O. Inter‐and intrarater reliability of Hurley staging for hidradenitis suppurativa. British Journal of Dermatology. 2019 Aug 1;181(2):344-9.
- Park, H.; Siosund, L.; Yoo, Y.; Monet, N.; Bang, J.; Kwak, N. Sinet: Extreme lightweight portrait segmentation networks with spatial squeeze module and information blocking decoder. In Proceedings of the IEEE/CVF Winter Conference on Applications of Computer Vision, Snowmass Village, CO, USA, 1–5 March 2020
- Rashataprucksa, K., Chuangchaichatchavarn, C., Triukose, S., Nitinawarat, S., Pongprutthipan, M. and Piromsopa, K., 2020, August. Acne detection with deep neural networks. In Proceedings of the 2020 2nd International Conference on Image Processing and Machine Vision (pp. 53-56).
- Rikhye RV, Hong GE, Singh P, Smith MA, Loh A, Muralidharan V, Wong D, Sayres R, Phung M, Betancourt N, Fong B. Differences between patient and clinician-taken images: implications for virtual care of skin conditions. Mayo Clinic Proceedings: Digital Health. 2024 Mar 1;2(1):107-18.
- Sangha A, Rizvi M. Detection of acne by deep learning object detection. medRxiv. 2021 Dec 11:2021-12.
- Schultheis M, Staubach‐Renz P, Grabbe S, Hennig K, Khoury F, Nikolakis G, Kirschner U. Can hidradenitis suppurativa patients classify their lesions by means of a digital lesion identification scheme?. JDDG: Journal der Deutschen Dermatologischen Gesellschaft. 2023 Jan;21(1):27-32.
- Sui Y, Shan X, Dai L, Jing H, Li B, Ma J. S 2 Head: Small-Size Human Head Detection Algorithm By Improved YOLOv8n Architecture. IEEE Access. 2025 Aug 7.
- Takwale A, Arthur E, Pearce J, Farrant P, Holmes S, Harries M. A practical guide to the standardization of hair loss photography for clinicians. Clinical and Experimental Dermatology. 2025 Mar;50(3):564-72.
- Thorlacius L, Garg A, Riis PT, Nielsen SM, Bettoli V, Ingram JR, Del Marmol V, Matusiak L, Pascual JC, Revuz J, Sartorius K. Inter‐rater agreement and reliability of outcome measurement instruments and staging systems used in hidradenitis suppurativa. British Journal of Dermatology. 2019 Sep 1;181(3):483-91.
- Wen H, Yu W, Wu Y, Zhao J, Liu X, Kuang Z, Fan R. Acne detection and severity evaluation with interpretable convolutional neural network models. Technology and Health Care. 2022 Jan;30(1_suppl):143-53.
- Xu H, Sarkar A, Abbott AL. Color invariant skin segmentation. InProceedings of the IEEE/CVF conference on computer vision and pattern recognition 2022 (pp. 2906-2915).
- You H, Lee K, Oh J, Lee EC. Efficient and low color information dependency skin segmentation model. Mathematics. 2023 Apr 26;11(9):2057.
- Zhang Z, Xia S, Cai Y, Yang C, Zeng S. A soft-YoloV4 for high-performance head detection and counting. Mathematics. 2021 Nov 30;9(23):3096.
- Kim JH, Kwon S, Fu J, Park JH. Hair Follicle Classification and Hair Loss Severity Estimation Using Mask R-CNN. J Imaging. 2022 Oct 14;8(10):283. doi: 10.3390/jimaging8100283.
- Gao M, Wang Y, Xu H, Xu C, Yang X, Nie J, Zhang Z, Li Z, Hou W, Jiang Y. Deep Learning-based Trichoscopic Image Analysis and Quantitative Model for Predicting Basic and Specific Classification in Male Androgenetic Alopecia. Acta Derm Venereol. 2022 Jan 26;102:adv00635. doi: 10.2340/actadv.v101.564.
- Lim HW, Cho M, Lee DH, Koh W, Kim Y, Chung JH, Kim S. Development of a Novel Automated Hair Counting System for the Quantitative Evaluation of Laser Hair Removal. Photomed Laser Surg. 2017 Feb;35(2):116-121. doi: 10.1089/pho.2016.4140.
Traceability to QMS Records
Signature meaning
The signatures for the approval process of this document can be found in the verified commits at the repository for the QMS. As a reference, the team members who are expected to participate in this document and their roles in the approval process, as defined in Annex I Responsibility Matrix of the GP-001, are:
- Author: Team members involved
- Reviewer: JD-003 Design & Development Manager, JD-004 Quality Manager & Person Responsible for Regulatory Compliance (PRRC)
- Approver: JD-001 General Manager
ㅤㅤ ㅤㅤ