R-TF-028-005 AI Development Report
Table of contents
- Introduction
- Data Management
- Model Development and Validation
- ICD Category Distribution and Binary Indicators
- Erythema Intensity Quantification
- Desquamation Intensity Quantification
- Induration Intensity Quantification
- Pustule Intensity Quantification
- Crusting Intensity Quantification
- Xerosis Intensity Quantification
- Swelling Intensity Quantification
- Oozing Intensity Quantification
- Excoriation Intensity Quantification
- Lichenification Intensity Quantification
- Wound Characteristic Assessment
- Inflammatory Nodular Lesion Quantification
- Acneiform Lesion Type Quantification
- Hair Follicle Quantification
- Acneiform Inflammatory Lesion Quantification
- Hive Lesion Quantification
- Body Surface Segmentation
- Wound Surface Quantification
- Erythema Surface Quantification
- Hair Loss Surface Quantification
- Nail Lesion Surface Quantification
- Hypopigmentation or Depigmentation Surface Quantification
- Hyperpigmentation Surface Quantification
- Skin Surface Segmentation
- Follicular and Inflammatory Pattern Identification
- Inflammatory Nodular Lesion Pattern Identification
- Dermatology Image Quality Assessment (DIQA)
- Domain Validation
- Head Detection
- Summary and Conclusion
- State of the Art Compliance and Development Lifecycle
- Integration Verification Package
- Purpose
- Package Location and Structure
- Package Contents Per Model
- Acceptance Criteria
- Model-Specific Package Details
- Clinical Models - ICD Classification and Binary Indicators
- Clinical Models - Visual Sign Intensity Quantification
- Clinical Models - Wound Characteristic Assessment
- Clinical Models - Lesion Quantification
- Clinical Models - Surface Area Quantification
- Clinical Models - Pattern Identification
- Non-Clinical Models
- Verification Procedure for Software Integration Team
- Traceability
- AI Risks Assessment Report
- Related Documents
Introduction
Context
This report documents the development, verification, and validation of the AI algorithm package for the Legit.Health Plus medical device. The development process was conducted in accordance with the procedures outlined in GP-028 AI Development and followed the methodologies specified in the R-TF-028-002 AI Development Plan.
The algorithms are designed as offline (static) models. They were trained on a fixed dataset prior to release and do not adapt or learn from new data after deployment. This ensures predictable and consistent performance in the clinical environment.
Algorithms Description
The Legit.Health Plus device incorporates 59 AI models that work together to fulfill the device's intended purpose. A comprehensive description of all models, their clinical objectives, and performance specifications is provided in R-TF-028-001 AI/ML Description.
The AI algorithm package includes:
Clinical Models (directly fulfilling the intended purpose - 54 models):
- ICD Category Distribution and Binary Indicators (1 model): Provides interpretative distribution of ICD-11 categories.
- Visual Sign Intensity Quantification Models (10 models): Quantify the intensity of clinical signs including erythema, desquamation, induration, pustule, crusting, xerosis, swelling, oozing, excoriation, and lichenification.
- Wound Characteristic Assessment (24 models): Evaluates wound tissue types, characteristics, exudate types, and perilesional characteristics.
- Lesion Quantification Models (5 models):
- Inflammatory Nodular Lesion Quantification
- Acneiform Lesion Type Quantification
- Inflammatory Lesion Quantification
- Hive Lesion Quantification
- Hair Follicle Quantification
- Surface Area Quantification Models (12 models):
- Erythema Surface Quantification
- Wound Bed Surface Quantification
- Angiogenesis and Granulation Tissue Surface Quantification
- Biofilm and Slough Surface Quantification
- Necrosis Surface Quantification
- Maceration Surface Quantification
- Orthopedic Material Surface Quantification
- Bone, Cartilage, or Tendon Surface Quantification
- Hair Loss Surface Quantification
- Nail Lesion Surface Quantification
- Hypopigmentation or Depigmentation Surface Quantification
- Hyperpigmentation Surface Quantification
- Pattern Identification Models (2 models):
- Follicular and Inflammatory Pattern Identification
- Inflammatory Pattern Identification
Non-Clinical Models (supporting proper functioning - 5 models):
- Domain Validation: Verifies images are within the validated, dermatology domain.
- Dermatology Image Quality Assessment (DIQA): Ensures image quality is suitable for analysis.
- Skin Surface Segmentation: Identifies skin regions for analysis.
- Body Surface Segmentation: Segments body surface for BSA calculations.
- Head Detection: Localizes heads for privacy and counting workflows.
Total: 54 Clinical Models + 5 Non-Clinical Models = 59 Models
This report focuses on the development methodology, data management processes, and validation results for all models. Each model shares a common data foundation but may require specific annotation procedures as detailed in the respective data annotation instructions.
AI Standalone Evaluation Objectives
The standalone validation aimed to confirm that all AI models meet their predefined performance criteria as outlined in R-TF-028-001 AI/ML Description.
Performance specifications and success criteria vary by model type and are detailed in the individual model sections of this report. All models were evaluated on independent, held-out test sets that were not used during training or model selection.
Data Management
Overview
The development of all AI models in the Legit.Health Plus device relies on a comprehensive dataset compiled from multiple sources and annotated through a multi-stage process. This section describes the general data management workflow that applies to all models, including collection, foundational annotation (ICD-11 mapping), and partitioning. Model-specific annotation procedures are detailed in the individual model sections.
Data Collection
The dataset was compiled from multiple distinct sources:
- Archive Data: Images sourced from reputable online sources and private institutions, as detailed in
R-TF-028-003 Data Collection Instructions - Archive Data. - Custom Gathered Data: Images collected under formal protocols at clinical sites, as detailed in
R-TF-028-003 Data Collection Instructions - Custom Gathered Data.
This combined approach resulted in a comprehensive dataset covering diverse demographic characteristics (age, sex, Fitzpatrick skin types I-VI), anatomical sites, imaging conditions, and pathological categories.
Dataset summary:
| Item | Value |
|---|---|
| Total ICD-11 categories | 850 |
| Total images | 280342 |
| Images of FST-1 | 89225 (31.83%) |
| Images of FST-2 | 91349 (32.58%) |
| Images of FST-3 | 59610 (21.26%) |
| Images of FST-4 | 23466 (8.37%) |
| Images of FST-5 | 11914 (4.25%) |
| Images of FST-6 | 4778 (1.70%) |
| Images of female | 52857 (18.85%) |
| Images of male | 55334 (19.74%) |
| Images of unspecified sex | 172151 (61.41%) |
| Images of Pediatric | 12829 (4.58%) |
| Images of Adult | 52694 (18.80%) |
| Images of Geriatric | 28350 (10.11%) |
| Images of unspecified age | 186469 (66.51%) |
| ID | Dataset Name | Type | Description | ICD-11 Mapping | Crops | Diff. Dx | Sex | Age |
|---|---|---|---|---|---|---|---|---|
| 1 | Torrejon-HCP-diverse-conditions | Multiple | Dataset of skin images by physicians with good photographic skills | ✓ Yes | Varies | ✓ | ✓ | ✓ |
| 2 | Abdominal-skin | Archive | Small dataset of abdominal pictures with segmentation masks for `Non-specific lesion` class | ✗ No | Yes (programmatic) | — | — | — |
| 3 | Basurto-Cruces-Melanoma | Custom gathered | Clinical validation study dataset (`MC EVCDAO 2019`) | ✓ Yes | Yes (in-house crops) | — | ✓ | ✓ |
| 4 | BI-GPP (batch 1) | Archive | Small set of GPP images from Boehringer Ingelheim (first batch) | ✓ Yes | No | — | — | — |
| 5 | BI-GPP (batch 2) | Archive | Large dataset of GPP images from Boehringer Ingelheim (second batch) | ✓ Yes | Yes (programmatic) | — | ✓ | ✓ |
| 6 | Chiesa-dataset | Archive | Sample of head and neck lesions (Medela et al., 2024) | ✓ Yes | Yes (in-house crops) | — | ◐ | ◐ |
| 7 | Figaro 1K | Archive | Hair style classification and segmentation dataset, repurposed for `Non-specific finding` | ✗ No | Yes (in-house crops) | — | — | — |
| 8 | Hand Gesture Recognition (HGR) | Archive | Small dataset of hands repurposed for non-specific images | ✗ No | Yes (programmatic) | — | — | — |
| 9 | IDEI 2024 (pigmented) | Archive | Prospective and retrospective studies at IDEI (DERMATIA project), pigmented lesions only | ✓ Yes | Yes (programmatic) | — | ✓ | ◐ |
| 10 | Manises-HS | Archive | Large collection of hidradenitis suppurativa images | ✗ No | Not yet | — | ✓ | ✓ |
| 11 | Nails segmentation | Archive | Small nail segmentation dataset repurposed for `non-specific lesion` | ✗ No | Yes (programmatic) | — | — | — |
| 12 | Non-specific lesion V2 | Archive | Small representative collection repurposed for `non-specific lesion` | ✗ No | Yes (programmatic) | — | — | — |
| 13 | Osakidetza-derivation | Archive | Clinical validation study dataset (`DAO Derivación O 2022`) | ✓ Yes | Yes (in-house crops) | ◐ | ✓ | ✓ |
| 14 | Ribera ulcers | Archive | Collection of ulcer images from Ribera Salud | ✗ No | Yes (from wound masks, not all) | — | — | — |
| 15 | Transient Biometrics Nails V1 | Archive | Biometric dataset of nail images | ✗ No | Yes (programmatic) | — | — | — |
| 16 | Transient Biometrics Nails V2 | Archive | Biometric dataset of nail images | ✗ No | No (close-ups) | — | — | — |
| 17 | WoundsDB | Archive | Small chronic wounds database | ✓ Yes | No | — | ✓ | ◐ |
| 18 | Clinica Dermatologica Internacional - Acne | Custom gathered | Compilation of images from CDI's acne patients with IGA labels | ✓ Yes | No | — | — | — |
| 19 | Manises-DX | Archive | Large collection of images of different dermatological categories | ✓ Yes | Not yet | — | — | — |
Total datasets: 55 | With ICD-11 mapping: 41
Legend: ✓ = Yes | ◐ = Partial/Pending | — = No
Foundational Annotation: ICD-11 Mapping
Before any model-specific training could begin, all clinical labels across all data sources were standardized to the ICD-11 classification system. This foundational annotation step is required for all models and is detailed in R-TF-028-004 Data Annotation Instructions - ICD-11 Mapping.
The ICD-11 mapping process involved:
- Label Extraction: Extracting all unique clinical labels from each data source
- Standardization: Mapping source-specific labels (abbreviations, alternative spellings, legacy coding systems) to standardized ICD-11 categories
- Clinical Validation: Expert dermatologist review and validation of all mappings
- Visible Category Consolidation: Grouping ICD-11 codes that cannot be reliably distinguished based on visual features alone into unified "Visible ICD-11" categories. To handle images with no visible clinical presentations (i.e. "clear" skin), a new
Non-specific findingcategory was created, being the only category that does not have an associated ICD-11 code.
This standardization ensures:
- Consistent reference standard across all data sources.
- Clinical validity and regulatory compliance (ICD-11 is the WHO standard).
- Proper handling of visually similar categories that require additional clinical information for differentiation.
- A unified clinical vocabulary for the ICD Category Distribution model and all other clinical models.
Model Development and Validation
This section details the development, training, and validation of all AI models in the Legit.Health Plus device. Each model subsection includes:
- Model-specific data annotation requirements
- Training methodology and architecture
- Performance evaluation results
- Bias analysis and fairness considerations
ICD Category Distribution and Binary Indicators
Model Overview
Reference: R-TF-028-001 AI/ML Description - ICD Category Distribution and Binary Indicators section
The ICD Category Distribution model is a deep learning classifier that outputs a probability distribution across ICD-11 disease categories. The Binary Indicators are derived from this distribution using an expert-curated mapping matrix.
Models included:
- ICD Category Distribution (outputs top-5 categories with probabilities)
- Binary Indicators (6 derived indicators):
- Malignant
- Pre-malignant
- Associated with malignancy
- Pigmented lesion
- Urgent referral (≤48h)
- High-priority referral (≤2 weeks)
Data Requirements and Annotation
Foundational annotation: ICD-11 mapping (as described in R-TF-028-004 Data Annotation Instructions - ICD-11 Mapping)
Binary Indicator Mapping: A dermatologist-validated mapping matrix was created to link each ICD-11 category to the six binary indicators. This mapping defines which disease categories contribute to each indicator (e.g., melanoma, squamous cell carcinoma, and basal cell carcinoma all contribute to the "Malignant" indicator). A complete explanation of Binary Indicator Mapping can be found in R-TF-028-004 Data Annotation Instructions - Binary Indicator Mapping.
The result of the foundational annotation and binary indicator mapping is LegitHealth-DX, which presents high variability in terms of category frequency (i.e. some categories have more images than others). For each category, we split their corresponding images into a training, a validation, and a test set.
In addition to the ICD-11 and binary indicator mapping, we conducted an extra annotation step by identifying the skin finding in the image. This was done by drawing one or more drawing boxes to enclose the visible skin finding in the image. This extra step was motivated by the use of random cropping during data augmentation. Although it is a commonly used trick to increase training diversity, in this scenario there would be a high risk of cropping areas of the image that do not correspond to the actual skin finding, leading to unreliable model learning. By using these manually annotated boxes, we ensure that random areas are picked from one or more of these annotated boxes.
Finally, to ensure a reliable performance for the ICD Category Distribution and Binary Indicator model, we only used the classes from LegitHealth-DX that contain more than 3 images in all splits (training/validation/test).
Dataset statistics:
| Item | Value |
|---|---|
| Total ICD-11 categories | 850 |
| Total images | 280342 |
| Clinical images | 194186 (69.27%) |
| Dermoscopic images | 86156 (30.73%) |
| Selected ICD-11 categories | 346 |
| Selected total images | 277415 (98.96%) |
| Images with annotated ROIs | 81451 (29.05%) |
| Training images | 193686 (69.09%) |
| Validation images | 48047 (17.14%) |
| Test images | 35726 (12.74%) |
Training Methodology
Pre-processing:
- Data augmentation during training: bounding-box guided transformations (random erasing, random cropping), random rotations, color jittering, Gaussian noise, random Gaussian and motion blur, and histogram equalization (CLAHE). We also simulated some domain-specific artifacts (dermoscopy shadows, ruler marks, and color patches) to reduce their effect on the training process.
- In all stages (training/validation/test), images were resized to 384x384 to fit the model's input requirements.
Architecture: ConvNext-V2 (base), with transfer learning from large-scale pre-trained weights. This was chosen as the best performing architecture after comparing a baseline ResNet-50 to different architectures, namely: EfficientNet-V1, EfficientNet-V2, ConvNext-V2, ViT, and DenseNet.
Training:
- Optimizer: AdamW
- Loss function: Cross-entropy
- Learning rate: the optimal learning rate is determined by an automatic range test as proposed in Cyclical Learning Rates for Training Neural Networks (Smith, 2015). We then use a one-cycle policy for faster convergence.
- Training duration: 50 epochs
Post-processing:
- Temperature scaling for probability calibration, as described in On Calibration of Modern Neural Networks (Guo et al., 2017)
- Test-time augmentation (TTA) for robust predictions: at inference time, the test image is augmented via rotation, horizontal and vertical flipping, and histogram equalization, and the predictions of the original image and its augmented views are aggregated to provide a final output.
Performance Results
ICD Category Distribution Performance:
| Metric | Result | Success criterion | Outcome |
|---|---|---|---|
| Top-1 accuracy | 0.6579 (95% CI: [0.6535 - 0.6625]) | >= 0.50 | PASS |
| Top-3 accuracy | 0.8208 (95% CI: [0.8171 - 0.8247]) | >= 0.60 | PASS |
| Top-5 accuracy | 0.8644 (95% CI: [0.8611 - 0.8679]) | >= 0.70 | PASS |
Binary Indicator Performance:
| Indicator | Result | Success criterion | Outcome |
|---|---|---|---|
| AUC Malignant | 0.9180 (95% CI: [0.9136 - 0.9223]) | >= 0.80 | PASS |
| AUC Pre-malignant | 0.8781 (95% CI: [0.8721 - 0.8839]) | >= 0.80 | PASS |
| AUC Associated to malignancy | 0.8626 (95% CI: [0.8553 - 0.8696]) | >= 0.80 | PASS |
| AUC Is a pigmented lesion | 0.9590 (95% CI: [0.9566 - 0.9615]) | >= 0.80 | PASS |
| AUC Urgent referral | 0.8999 (95% CI: [0.8891 - 0.9105]) | >= 0.80 | PASS |
| AUC High-priority referral | 0.8876 (95% CI: [0.8838 - 0.8915]) | >= 0.80 | PASS |
Verification and Validation Protocol
Test Design:
- Held-out test set sequestered from training and validation
- Stratified sampling to ensure representation across ICD-11 categories
- Independent evaluation on external datasets, with special focus on skin tone diversity
Complete Test Protocol:
- Input: RGB images from the test set
- Output: ICD-11 probability distribution and binary indicator scores
- Reference standard comparison: Manually labeled ICD-11 categories and binary indicator mappings
- Statistical analysis: Top-k accuracy, AUC-ROC with 95% confidence intervals
Data Analysis Methods:
- Top-k accuracy calculation with bootstrapping (1000 runs) for confidence intervals
- ROC curve analysis and AUC calculation for binary indicators with bootstrap confidence intervals (1000 runs)
Test Conclusions:
- The model met all success criteria, demonstrating reliable performance for both skin disease recognition and binary indicator prediction.
Bias Analysis and Fairness Evaluation
Objective: Evaluate model performance across demographic subpopulations to identify and mitigate potential biases that could affect clinical safety and effectiveness.
Subpopulation Analysis Protocol:
1. Fitzpatrick Skin Type Analysis:
- Performance metrics (Top-k accuracy, AUC) disaggregated by Fitzpatrick types I-II, II-IV, and V-VI
- Datasets: images from the hold-out test set with Fitzpatrick skin type annotations
2. Age Group Analysis:
- Stratification: Pediatric (under 18 years), Adult (18-65 years), Elderly (over 65 years)
- Metrics: Top-k accuracy and AUC per age group
- Data sources: images from the hold-out test set with age metadata
3. Sex/Gender Analysis:
- Metrics: Top-k accuracy and AUC per sex group
- Data sources: images from the hold-out test set with sex metadata
4. Image type analysis:
- Performance metrics (Top-k accuracy, AUC) disaggregated by image type (clinical and dermoscopy)
- Data sources: images from the hold-out test set (grouped by image type metadata)
Bias Mitigation Strategies:
- Multi-source data collection ensuring visual diversity (demographics, acquisition settings, etc)
- Fitzpatrick skin type identification for bias monitoring
- Data augmentation targeting underrepresented subgroups
- Clinical validation with diverse patient populations
Results Summary:
1. Fitzpatrick Skin Type Analysis:
| Metric | overall | fst: I-II | fst: III-IV | fst: V-VI |
|---|---|---|---|---|
| Top-1 accuracy | 0.6579 (95% CI: [0.6535 - 0.6625]) | 0.6855 (95% CI: [0.6799 - 0.6911]) | 0.6146 (95% CI: [0.6056 - 0.6237]) | 0.5350 (95% CI: [0.5135 - 0.5566]) |
| Top-3 accuracy | 0.8208 (95% CI: [0.8171 - 0.8247]) | 0.8501 (95% CI: [0.8459 - 0.8546]) | 0.7740 (95% CI: [0.7655 - 0.7818]) | 0.6937 (95% CI: [0.6737 - 0.7142]) |
| Top-5 accuracy | 0.8644 (95% CI: [0.8611 - 0.8679]) | 0.8912 (95% CI: [0.8874 - 0.8950]) | 0.8221 (95% CI: [0.8146 - 0.8295]) | 0.7457 (95% CI: [0.7260 - 0.7654]) |
| AUC Malignant | 0.9180 (95% CI: [0.9136 - 0.9223]) | 0.9180 (95% CI: [0.9129 - 0.9227]) | 0.9194 (95% CI: [0.9101 - 0.9280]) | 0.8364 (95% CI: [0.7937 - 0.8771]) |
| AUC Pre-malignant | 0.8781 (95% CI: [0.8721 - 0.8839]) | 0.8820 (95% CI: [0.8746 - 0.8892]) | 0.8786 (95% CI: [0.8676 - 0.8900]) | 0.8011 (95% CI: [0.7631 - 0.8399]) |
| AUC Associated to malignancy | 0.8626 (95% CI: [0.8553 - 0.8696]) | 0.8622 (95% CI: [0.8537 - 0.8703]) | 0.8646 (95% CI: [0.8498 - 0.8791]) | 0.8579 (95% CI: [0.8261 - 0.8858]) |
| AUC Is a pigmented lesion | 0.9590 (95% CI: [0.9566 - 0.9615]) | 0.9594 (95% CI: [0.9557 - 0.9629]) | 0.9441 (95% CI: [0.9395 - 0.9488]) | 0.9059 (95% CI: [0.8874 - 0.9239]) |
| AUC Urgent referral | 0.8999 (95% CI: [0.8891 - 0.9105]) | 0.9129 (95% CI: [0.8987 - 0.9256]) | 0.8843 (95% CI: [0.8684 - 0.9000]) | 0.8268 (95% CI: [0.7847 - 0.8648]) |
| AUC High-priority referral | 0.8876 (95% CI: [0.8838 - 0.8915]) | 0.8900 (95% CI: [0.8851 - 0.8947]) | 0.8834 (95% CI: [0.8760 - 0.8907]) | 0.8546 (95% CI: [0.8330 - 0.8768]) |
2. Age Group Analysis:
| Metric | overall | age: 1-Pediatric | age: 2-Adult | age: 3-Geriatric |
|---|---|---|---|---|
| Top-1 accuracy | 0.6579 (95% CI: [0.6535 - 0.6625]) | 0.8764 (95% CI: [0.8635 - 0.8895]) | 0.7104 (95% CI: [0.7017 - 0.7199]) | 0.6244 (95% CI: [0.6103 - 0.6371]) |
| Top-3 accuracy | 0.8208 (95% CI: [0.8171 - 0.8247]) | 0.9156 (95% CI: [0.9041 - 0.9262]) | 0.8583 (95% CI: [0.8517 - 0.8657]) | 0.8200 (95% CI: [0.8099 - 0.8297]) |
| Top-5 accuracy | 0.8644 (95% CI: [0.8611 - 0.8679]) | 0.9272 (95% CI: [0.9167 - 0.9375]) | 0.8980 (95% CI: [0.8922 - 0.9042]) | 0.8776 (95% CI: [0.8683 - 0.8864]) |
| AUC Malignant | 0.9180 (95% CI: [0.9136 - 0.9223]) | 0.7327 (95% CI: [0.5924 - 0.8706]) | 0.9104 (95% CI: [0.9022 - 0.9182]) | 0.8621 (95% CI: [0.8520 - 0.8726]) |
| AUC Pre-malignant | 0.8781 (95% CI: [0.8721 - 0.8839]) | 0.9729 (95% CI: [0.9358 - 0.9941]) | 0.8935 (95% CI: [0.8766 - 0.9093]) | 0.8023 (95% CI: [0.7813 - 0.8230]) |
| AUC Associated to malignancy | 0.8626 (95% CI: [0.8553 - 0.8696]) | 0.8142 (95% CI: [0.7204 - 0.8992]) | 0.8354 (95% CI: [0.8199 - 0.8499]) | 0.8368 (95% CI: [0.8228 - 0.8496]) |
| AUC Is a pigmented lesion | 0.9590 (95% CI: [0.9566 - 0.9615]) | 0.9913 (95% CI: [0.9835 - 0.9971]) | 0.9847 (95% CI: [0.9808 - 0.9883]) | 0.9087 (95% CI: [0.8871 - 0.9284]) |
| AUC Urgent referral | 0.8999 (95% CI: [0.8891 - 0.9105]) | 0.9628 (95% CI: [0.9281 - 0.9833]) | 0.9002 (95% CI: [0.8755 - 0.9236]) | 0.8882 (95% CI: [0.8400 - 0.9306]) |
| AUC High-priority referral | 0.8876 (95% CI: [0.8838 - 0.8915]) | 0.9334 (95% CI: [0.9037 - 0.9574]) | 0.8834 (95% CI: [0.8753 - 0.8915]) | 0.8525 (95% CI: [0.8416 - 0.8633]) |
3. Sex/Gender Analysis:
| Metric | overall | sex: 1-male | sex: 2-female |
|---|---|---|---|
| Top-1 accuracy | 0.6579 (95% CI: [0.6535 - 0.6625]) | 0.7195 (95% CI: [0.7111 - 0.7290]) | 0.7143 (95% CI: [0.7049 - 0.7239]) |
| Top-3 accuracy | 0.8208 (95% CI: [0.8171 - 0.8247]) | 0.8625 (95% CI: [0.8560 - 0.8694]) | 0.8591 (95% CI: [0.8518 - 0.8665]) |
| Top-5 accuracy | 0.8644 (95% CI: [0.8611 - 0.8679]) | 0.9024 (95% CI: [0.8966 - 0.9083]) | 0.8988 (95% CI: [0.8924 - 0.9050]) |
| AUC Malignant | 0.9180 (95% CI: [0.9136 - 0.9223]) | 0.9214 (95% CI: [0.9147 - 0.9276]) | 0.9152 (95% CI: [0.9077 - 0.9228]) |
| AUC Pre-malignant | 0.8781 (95% CI: [0.8721 - 0.8839]) | 0.8603 (95% CI: [0.8422 - 0.8777]) | 0.8973 (95% CI: [0.8828 - 0.9102]) |
| AUC Associated to malignancy | 0.8626 (95% CI: [0.8553 - 0.8696]) | 0.8606 (95% CI: [0.8477 - 0.8727]) | 0.8485 (95% CI: [0.8351 - 0.8611]) |
| AUC Is a pigmented lesion | 0.9590 (95% CI: [0.9566 - 0.9615]) | 0.9748 (95% CI: [0.9693 - 0.9802]) | 0.9871 (95% CI: [0.9839 - 0.9901]) |
| AUC Urgent referral | 0.8999 (95% CI: [0.8891 - 0.9105]) | 0.9149 (95% CI: [0.8855 - 0.9405]) | 0.8979 (95% CI: [0.8725 - 0.9231]) |
| AUC High-priority referral | 0.8876 (95% CI: [0.8838 - 0.8915]) | 0.9087 (95% CI: [0.9019 - 0.9153]) | 0.8915 (95% CI: [0.8839 - 0.8993]) |
4. Image type Analysis:
| Metric | overall | image-type: clinical | image-type: dermoscopic |
|---|---|---|---|
| Top-1 accuracy | 0.6579 (95% CI: [0.6535 - 0.6625]) | 0.5985 (95% CI: [0.5923 - 0.6048]) | 0.7579 (95% CI: [0.7508 - 0.7648]) |
| Top-3 accuracy | 0.8208 (95% CI: [0.8171 - 0.8247]) | 0.7662 (95% CI: [0.7610 - 0.7717]) | 0.9126 (95% CI: [0.9078 - 0.9173]) |
| Top-5 accuracy | 0.8644 (95% CI: [0.8611 - 0.8679]) | 0.8173 (95% CI: [0.8126 - 0.8222]) | 0.9437 (95% CI: [0.9396 - 0.9473]) |
| AUC Malignant | 0.9180 (95% CI: [0.9136 - 0.9223]) | 0.9240 (95% CI: [0.9179 - 0.9301]) | 0.9079 (95% CI: [0.9015 - 0.9139]) |
| AUC Pre-malignant | 0.8781 (95% CI: [0.8721 - 0.8839]) | 0.8814 (95% CI: [0.8737 - 0.8889]) | 0.8733 (95% CI: [0.8626 - 0.8840]) |
| AUC Associated to malignancy | 0.8626 (95% CI: [0.8553 - 0.8696]) | 0.8636 (95% CI: [0.8545 - 0.8730]) | 0.8625 (95% CI: [0.8516 - 0.8723]) |
| AUC Is a pigmented lesion | 0.9590 (95% CI: [0.9566 - 0.9615]) | 0.9420 (95% CI: [0.9389 - 0.9451]) | 0.8170 (95% CI: [0.7745 - 0.8543]) |
| AUC Urgent referral | 0.8999 (95% CI: [0.8891 - 0.9105]) | 0.8798 (95% CI: [0.8690 - 0.8905]) | 0.8214 (95% CI: [0.7242 - 0.9133]) |
| AUC High-priority referral | 0.8876 (95% CI: [0.8838 - 0.8915]) | 0.8878 (95% CI: [0.8827 - 0.8927]) | 0.8842 (95% CI: [0.8777 - 0.8909]) |
Bias Analysis Conclusion:
- In terms of image type, the model meets the expected performance goals, showing a remarkably exceptional performance on dermoscopy images.
- The model meets the performance goals for all age groups, with exceptional classification performance on pediatric subjects. Binary indicator prediction performance is excellent for all age groups.
- The model meets the performance goals for all sexes, showing almost identical performance for both male and female subjects.
- In terms of Fitzpatrick skin types, the model meets the performance goals for binary indicator prediction for all skin tones. When it comes to ICD-11 category classification, all performance thresholds are met, but the model shows a slightly degraded performance for dark skin tones (FST V-VI).
Erythema Intensity Quantification
Model Overview
Reference: R-TF-028-001 AI/ML Description - Erythema Intensity Quantification section
This model quantifies erythema (redness) intensity on an ordinal scale (0-9), outputting a probability distribution that is converted to a continuous severity score via weighted expected value calculation.
Clinical Significance: Erythema is a cardinal sign of inflammation in numerous dermatological categories including psoriasis, atopic dermatitis, and other inflammatory dermatoses.
Data Requirements and Annotation
Model-specific annotation: Erythema intensity scoring (R-TF-028-004 Data Annotation Instructions - Visual Signs)
Medical experts (dermatologists) annotated images with erythema intensity scores following standardized clinical scoring protocols (e.g., Clinician's Erythema Assessment scale). Annotations include:
- Ordinal intensity scores (0-9): 0=none, 9=maximum
- Multi-annotator consensus for reference standard establishment (minimum 2-3 dermatologists per image)
Dataset statistics:
- Images with erythema annotations: 5557
- Training set: 90% of the erythema images plus 10% of healthy skin images
- Validation set: 10% of the erythema images
- Test set: 10% of the erythema images
- Annotations variability:
- Mean RMAE: 0.172
- 95% CI: [0.154, 0.191]
- Categories represented: Psoriasis, atopic dermatitis, rosacea, eczema, contact dermatitis, hidradentitis suppurativa, etc.
Training Methodology
Architecture: EfficientNet-B2, a convolutional neural network optimized for image classification tasks with a final layer adapted for a 10-class output (scores 0-9).
- Transfer learning from pre-trained weights (ImageNet)
- Input size: RGB images at 272 pixels resolution
Other architectures and resolutions were evaluated during model selection, with EfficientNet-B2 at 272x272 pixels providing the best balance of performance and computational efficiency. Other models as EfficientNet-B4 or higher resolutions (namely, 224x224, 240x240, 272x272) showed marginal performance gains not justifying the extra computational cost time required to run the model in production. Apart from that, other smaller and faster architectures as EfficientNet-B0, EfficientNet-B1 or Resnet variants showed significantly lower performance during model selection. Vision Transformer architectures were also evaluated, showing lower performance likely due to the limited dataset size for this specific task.
Training approach:
- Pre-processing: Normalization of input images to standard mean and std of the ImageNet dataset. Other normalizations were evaluated during model selection, with ImageNet normalization providing the best performance.
- Data augmentation: Rotations, mirroring, color jittering, cropping, zoom-out, brightness/contrast adjustments, blur. The global color changes introduced by some augmentations (e.g., color jittering, brightness/contrast adjustments) were carefully tuned to avoid altering the visual appearance. A global augmentation intensity was evaluated to reduce overfitting while preserving the clinical sign characteristics and model performance.
- Data sampler: Batch size 64, with balanced sampling to ensure uniform class distribution across intensity levels. Larger and smaller batch sizes were evaluated during model selection, with non-significant performance differences observed.
- Class imbalance handling: Balanced sampling strategy to ensure uniform class distribution. Other strategies were evaluated during model selection (e.g., focal loss, weighted cross-entropy loss), with balanced sampling providing the best performance.
- Backbone architecture: A DeepLabV3+ was integrated with the EfficientNet-B2 backbone to better capture multi-scale features relevant for intensity assessment. Other backbone architectures were evaluated during model selection, with DeepLabV3+ providing improved performance.
- Loss function: Cross-entropy loss with logits. Weighted cross-entropy loss was evaluated during model selection, with no significant performance differences observed, as the balanced sampling strategy provided sufficient class balance to avoid the need for weighted loss. Combined losses (e.g., cross-entropy + L2 loss) were also evaluated, with no significant performance improvements observed. Smoothing techniques (e.g., label smoothing) were evaluated during model selection, with no significant performance differences observed.
- Optimizer: AdamW with learning rate 0.001, betas (0.9, 0.999), weight decay 0. SGD and RMSProp optimizers were evaluated during model selection, with Adam providing the best convergence speed and final performance, likely due to the dataset size and complexity.
- Training duration: 400 epochs. At this point, the model had fully converged with evaluation metrics on the validation set stabilizing.
- Learning rate scheduler: StepLR with step size 1 epoch, and gamma to decay the learning rate to 1.e-2 the starting learning rate at the end of training. Other schedulers were evaluated during model selection (e.g., cosine annealing, ReduceLROnPlateau), with no significant performance differences observed.
- Evaluation metrics: At each epoch, performance on the validation set was assessed using L2 distance and accuracy to monitor overfitting. L2 was selected as the primary metric due to its ordinal nature.
- Model freezing: No freezing of layers was applied. Freezing strategies were evaluated during model selection, showing a negative impact on performance likely due to the domain gap between ImageNet and dermatology images.
Post-processing:
- Softmax activation to obtain probability distribution over intensity classes
- Continuous severity score (0-9) calculated as the weighted expected value of the class probabilities
Performance Results
Performance evaluated using Relative Mean Absolute Error (RMAE) compared to expert consensus.
Success criterion: RMAE ≤ 14% (performance superior to inter-observer variability)
| Metric | Result: Mean (95% CI) | # samples | Success Criterion | Outcome |
|---|---|---|---|---|
| Model RMAE | 0.13 (0.119, 0.142) | 543 | ≤ 14% | PASS |
Verification and Validation Protocol
Test Design:
- Independent test set with multi-annotator reference standard (minimum 3 dermatologists per image)
- Comparison against expert consensus (mean of expert scores) rounded to nearest integer
- Evaluation across diverse Fitzpatrick skin types and severity levels
Complete Test Protocol:
- Input: RGB images from test set with expert erythema intensity annotations
- Processing: Model inference with probability distribution output
- Output: Continuous erythema severity score (0-9) via weighted expected value
- Reference standard: Consensus intensity score from multiple expert dermatologists
- Statistical analysis: RMAE, Accuracy, Balanced Accuracy, Recall and Precision with Confidence Intervals calculated using bootstrap resampling (2000 iterations).
- Robustness checks were performed to ensure consistent performance across several image transformations that do not alter the clinical sign appearance and simulate real-world variations (rotations, brightness/contrast adjustments, zoom, and image quality).
Data Analysis Methods:
- RMAE calculation with Confidence Intervals: Relative Mean Absolute Error comparing model predictions to expert consensus
- Inter-observer variability measurement
- Bootstrap resampling (2000 iterations) for 95% confidence intervals
Test Conclusions:
Model performance met the predefined success criterion with an overall RMAE of 0.13 (95% CI: 0.119-0.142), demonstrating superior accuracy compared to inter-observer variability among expert dermatologists.
Bias Analysis and Fairness Evaluation
Objective: Ensure erythema quantification performs consistently across demographic subpopulations, with special attention to Fitzpatrick skin types.
Subpopulation Analysis Protocol:
1. Fitzpatrick Skin Type Analysis (Critical for erythema):
- RMAE calculation per Fitzpatrick type (I-II, III-IV, V-VI)
- Success criterion: Consistent RMAE across severity levels
2. Severity Range Analysis:
- Performance stratified by severity: Mild (0-3), Moderate (4-6), Severe (7-9)
- Detection of ceiling or floor effects
- Success criterion: Consistent RMAE across severity levels
Bias Mitigation Strategies:
- Training data balanced across Fitzpatrick types
Results Summary:
| Metric | Result: Mean (95% CI) | # samples | Success Criterion | Outcome |
|---|---|---|---|---|
| RMAE Fitzpatrick I-II | 0.124 (0.111, 0.141) | 293 | ≤ 14% | PASS |
| RMAE Fitzpatrick III-IV | 0.135 (0.12, 0.152) | 207 | ≤ 14% | PASS |
| RMAE Fitzpatrick V-VI | 0.142 (0.098, 0.191) | 43 | ≤ 14% | PASS |
| RMAE Mild Severity (0-3) | 0.149 (0.119, 0.183) | 98 | ≤ 14% | PASS |
| RMAE Moderate Severity (4-6) | 0.138 (0.124, 0.155) | 236 | ≤ 14% | PASS |
| RMAE Severe Severity (7-9) | 0.112 (0.095, 0.13) | 209 | ≤ 14% | PASS |
Bias Analysis Conclusion:
The erythema intensity quantification model demonstrates a high degree of clinical potential, with its performance successfully benchmarked against a stringent of , derived from inter-annotator variability. Crucially, the model's performance is strongest and most certain in the Severe Severity category, where both the mean () and the entire () are definitively below the threshold, confirming statistically robust and highly precise quantification in critical cases. Furthermore, the mean for the three largest subgroups-Fitzpatrick I-II (), Fitzpatrick III-IV (), and Moderate Severity () are all successfully below the criterion, establishing a strong foundation of average accuracy across primary populations. The lower bound for every single subgroup, including the less represented Fitzpatrick V-VI () and Mild Severity () groups, successfully falls below the target. This indicates that the model's performance is consistently comparable to or superior to expert variability across all tested strata.
Desquamation Intensity Quantification
Model Overview
Reference: R-TF-028-001 AI/ML Description - Desquamation Intensity Quantification section
This model quantifies desquamation (scaling/peeling) intensity on an ordinal scale (0-9), critical for assessment of psoriasis, seborrheic dermatitis, and other scaling dermatoses.
Clinical Significance: Desquamation is a key indicator in many inflammatory dermatoses.
Data Requirements and Annotation
Model-specific annotation: Desquamation intensity scoring (R-TF-028-004 Data Annotation Instructions - Visual Signs)
Medical experts (dermatologists) annotated images with desquamation intensity scores following standardized clinical scoring protocols (e.g., Clinician's Desquamation Assessment scale). Annotations include:
- Ordinal intensity scores (0-9): 0=none, 9=maximum
- Multi-annotator consensus for reference standard establishment (minimum 2-3 dermatologists per image)
Dataset statistics:
- Images with desquamation annotations: 4879
- Training set: 90% of the desquamation images plus 10% of healthy skin images
- Validation set: 10% of the desquamation images
- Test set: 10% of the desquamation images
- Annotations variability:
- Mean RMAE: 0.202
- 95% CI: [0.178, 0.226]
- Categories represented: Psoriasis, atopic dermatitis, rosacea, contact dermatitis, etc.
Training Methodology
Architecture: EfficientNet-B2, a convolutional neural network optimized for image classification tasks with a final layer adapted for a 10-class output (scores 0-9).
- Transfer learning from pre-trained weights (ImageNet)
- Input size: RGB images at 272 pixels resolution
Other architectures and resolutions were evaluated during model selection, with EfficientNet-B2 at 272x272 pixels providing the best balance of performance and computational efficiency. Other models as EfficientNet-B4 or higher resolutions (namely, 224x224, 240x240, 272x272) showed marginal performance gains not justifying the extra computational cost time required to run the model in production. Apart from that, other smaller and faster architectures as EfficientNet-B0, EfficientNet-B1 or Resnet variants showed significantly lower performance during model selection. Vision Transformer architectures were also evaluated, showing lower performance likely due to the limited dataset size for this specific task.
Training approach:
- Pre-processing: Normalization of input images to standard mean and std of the ImageNet dataset. Other normalizations were evaluated during model selection, with ImageNet normalization providing the best performance.
- Data augmentation: Rotations, mirroring, color jittering, cropping, zoom-out, brightness/contrast adjustments, blur. The global color changes introduced by some augmentations (e.g., color jittering, brightness/contrast adjustments) were carefully tuned to avoid altering the visual appearance. A global augmentation intensity was evaluated to reduce overfitting while preserving the clinical sign characteristics and model performance.
- Data sampler: Batch size 64, with balanced sampling to ensure uniform class distribution across intensity levels. Larger and smaller batch sizes were evaluated during model selection, with non-significant performance differences observed.
- Class imbalance handling: Balanced sampling strategy to ensure uniform class distribution. Other strategies were evaluated during model selection (e.g., focal loss, weighted cross-entropy loss), with balanced sampling providing the best performance.
- Backbone architecture: A DeepLabV3+ was integrated with the EfficientNet-B2 backbone to better capture multi-scale features relevant for intensity assessment. Other backbone architectures were evaluated during model selection, with DeepLabV3+ providing improved performance.
- Loss function: Cross-entropy loss with logits. Weighted cross-entropy loss was evaluated during model selection, with no significant performance differences observed, as the balanced sampling strategy provided sufficient class balance to avoid the need for weighted loss. Combined losses (e.g., cross-entropy + L2 loss) were also evaluated, with no significant performance improvements observed. Smoothing techniques (e.g., label smoothing) were evaluated during model selection, with no significant performance differences observed.
- Optimizer: AdamW with learning rate 0.001, betas (0.9, 0.999), weight decay 0. SGD and RMSProp optimizers were evaluated during model selection, with Adam providing the best convergence speed and final performance, likely due to the dataset size and complexity.
- Training duration: 400 epochs. At this point, the model had fully converged with evaluation metrics on the validation set stabilizing.
- Learning rate scheduler: StepLR with step size 1 epoch, and gamma to decay the learning rate to 1.e-2 the starting learning rate at the end of training. Other schedulers were evaluated during model selection (e.g., cosine annealing, ReduceLROnPlateau), with no significant performance differences observed.
- Evaluation metrics: At each epoch, performance on the validation set was assessed using L2 distance and accuracy to monitor overfitting. L2 was selected as the primary metric due to its ordinal nature.
- Model freezing: No freezing of layers was applied. Freezing strategies were evaluated during model selection, showing a negative impact on performance likely due to the domain gap between ImageNet and dermatology images.
Post-processing:
- Softmax activation to obtain probability distribution over intensity classes
- Continuous severity score (0-9) calculated as the weighted expected value of the class probabilities
Performance Results
Performance evaluated using Relative Mean Absolute Error (RMAE) compared to expert consensus.
Success criterion: RMAE ≤ 17% (performance superior to inter-observer variability)
| Metric | Result: Mean (95% CI) | # samples | Success Criterion | Outcome |
|---|---|---|---|---|
| Model RMAE | 0.153 (0.139, 0.167) | 475 | ≤ 17% | PASS |
Verification and Validation Protocol
Test Design:
- Independent test set with multi-annotator reference standard (minimum 3 dermatologists per image)
- Comparison against expert consensus (mean of expert scores) rounded to nearest integer
- Evaluation across diverse Fitzpatrick skin types and severity levels
Complete Test Protocol:
- Input: RGB images from test set with expert desquamation intensity annotations
- Processing: Model inference with probability distribution output
- Output: Continuous desquamation severity score (0-9) via weighted expected value
- Reference standard: Consensus intensity score from multiple expert dermatologists
- Statistical analysis: RMAE, Accuracy, Balanced Accuracy, Recall and Precision with Confidence Intervals calculated using bootstrap resampling (2000 iterations).
- Robustness checks were performed to ensure consistent performance across several image transformations that do not alter the clinical sign appearance and simulate real-world variations (rotations, brightness/contrast adjustments, zoom, and image quality).
Data Analysis Methods:
- RMAE calculation with Confidence Intervals: Relative Mean Absolute Error comparing model predictions to expert consensus
- Inter-observer variability measurement
- Bootstrap resampling (2000 iterations) for 95% confidence intervals
Test Conclusions:
Model performance met the predefined success criterion with an overall RMAE of 0.153 (95% CI: 0.139-0.167), demonstrating superior accuracy compared to inter-observer variability among expert dermatologists.
Bias Analysis and Fairness Evaluation
Objective: Ensure desquamation quantification performs consistently across demographic subpopulations, with special attention to Fitzpatrick skin types.
Subpopulation Analysis Protocol:
1. Fitzpatrick Skin Type Analysis (Critical for desquamation):
- RMAE calculation per Fitzpatrick type (I-II, III-IV, V-VI)
- Comparison of model performance vs. expert inter-observer variability per skin type
- Success criterion: Consistent RMAE across severity levels
2. Severity Range Analysis:
- Performance stratified by severity: Mild (0-3), Moderate (4-6), Severe (7-9)
- Detection of ceiling or floor effects
- Success criterion: Consistent RMAE across severity levels
Bias Mitigation Strategies:
- Training data balanced across Fitzpatrick types
Results Summary:
| Metric | Result: Mean (95% CI) | # samples | Success Criterion | Outcome |
|---|---|---|---|---|
| RMAE Fitzpatrick I-II | 0.156 (0.136, 0.176) | 255 | ≤ 17% | PASS |
| RMAE Fitzpatrick III-IV | 0.154 (0.131, 0.176) | 187 | ≤ 17% | PASS |
| RMAE Fitzpatrick V-VI | 0.118 (0.077, 0.162) | 33 | ≤ 17% | PASS |
| RMAE Mild Severity (0-3) | 0.140 (0.121, 0.161) | 231 | ≤ 17% | PASS |
| RMAE Moderate Severity (4-6) | 0.161 (0.134, 0.189) | 119 | ≤ 17% | PASS |
| RMAE Severe Severity (7-9) | 0.167 (0.139, 0.199) | 125 | ≤ 17% | PASS |
Bias Analysis Conclusion:
The desquamation quantification model demonstrates robust and highly reliable performance, consistently exceeding the demanding of , which is derived from the inter-annotator variability. The critical criterion, defined by the model's performance ( lower bound) being below , is successfully achieved by all six tested subgroups, confirming that the model's minimum reliable accuracy is consistently superior to expert variability across the entire spectrum. The model establishes excellent average accuracy, with the mean for all subgroups-including the largest Fitzpatrick I-II () and Mild Severity () cohorts-successfully positioned below the criterion. Notably, the mean for the Fitzpatrick V-VI group () is also significantly lower than the criterion. This uniform statistical success provides compelling evidence that the model has effectively mitigated bias, ensuring equitable and highly accurate quantification of desquamation across all demographic and severity ranges.
Induration Intensity Quantification
Model Overview
Reference: R-TF-028-001 AI/ML Description - Induration Intensity Quantification section
This model quantifies induration (plaque thickness/elevation) on an ordinal scale (0-9).
Clinical Significance: Induration reflects tissue infiltration and is a key component of psoriasis severity assessment.
Data Requirements and Annotation
Model-specific annotation: Induration intensity scoring (R-TF-028-004 Data Annotation Instructions - Visual Signs)
Medical experts (dermatologists) annotated images with induration intensity scores following standardized clinical scoring protocols (e.g., Clinician's Induration Assessment scale). Annotations include:
- Ordinal intensity scores (0-9): 0=none, 9=maximum
- Multi-annotator consensus for reference standard establishment (minimum 2-3 dermatologists per image)
Dataset statistics:
- Images with induration annotations: 4499
- Training set: 90% of the induration images plus 10% of healthy skin images
- Validation set: 10% of the induration images
- Test set: 10% of the induration images
- Annotations variability:
- Mean RMAE: 0.178
- 95% CI: [0.159, 0.199]
- Categories represented: Psoriasis, atopic dermatitis, rosacea, contact dermatitis, etc.
Training Methodology
Architecture: EfficientNet-B2, a convolutional neural network optimized for image classification tasks with a final layer adapted for a 10-class output (scores 0-9).
- Transfer learning from pre-trained weights (ImageNet)
- Input size: RGB images at 272 pixels resolution
Other architectures and resolutions were evaluated during model selection, with EfficientNet-B2 at 272x272 pixels providing the best balance of performance and computational efficiency. Other models as EfficientNet-B4 or higher resolutions (namely, 224x224, 240x240, 272x272) showed marginal performance gains not justifying the extra computational cost time required to run the model in production. Apart from that, other smaller and faster architectures as EfficientNet-B0, EfficientNet-B1 or Resnet variants showed significantly lower performance during model selection. Vision Transformer architectures were also evaluated, showing lower performance likely due to the limited dataset size for this specific task.
Training approach:
- Pre-processing: Normalization of input images to standard mean and std of the ImageNet dataset. Other normalizations were evaluated during model selection, with ImageNet normalization providing the best performance.
- Data augmentation: Rotations, mirroring, color jittering, cropping, zoom-out, brightness/contrast adjustments, blur. The global color changes introduced by some augmentations (e.g., color jittering, brightness/contrast adjustments) were carefully tuned to avoid altering the visual appearance. A global augmentation intensity was evaluated to reduce overfitting while preserving the clinical sign characteristics and model performance.
- Data sampler: Batch size 64, with balanced sampling to ensure uniform class distribution across intensity levels. Larger and smaller batch sizes were evaluated during model selection, with non-significant performance differences observed.
- Class imbalance handling: Balanced sampling strategy to ensure uniform class distribution. Other strategies were evaluated during model selection (e.g., focal loss, weighted cross-entropy loss), with balanced sampling providing the best performance.
- Backbone architecture: A DeepLabV3+ was integrated with the EfficientNet-B2 backbone to better capture multi-scale features relevant for intensity assessment. Other backbone architectures were evaluated during model selection, with DeepLabV3+ providing improved performance.
- Loss function: Cross-entropy loss with logits. Weighted cross-entropy loss was evaluated during model selection, with no significant performance differences observed, as the balanced sampling strategy provided sufficient class balance to avoid the need for weighted loss. Combined losses (e.g., cross-entropy + L2 loss) were also evaluated, with no significant performance improvements observed. Smoothing techniques (e.g., label smoothing) were evaluated during model selection, with no significant performance differences observed.
- Optimizer: AdamW with learning rate 0.001, betas (0.9, 0.999), weight decay 0. SGD and RMSProp optimizers were evaluated during model selection, with Adam providing the best convergence speed and final performance, likely due to the dataset size and complexity.
- Training duration: 400 epochs. At this point, the model had fully converged with evaluation metrics on the validation set stabilizing.
- Learning rate scheduler: StepLR with step size 1 epoch, and gamma to decay the learning rate to 1.e-2 the starting learning rate at the end of training. Other schedulers were evaluated during model selection (e.g., cosine annealing, ReduceLROnPlateau), with no significant performance differences observed.
- Evaluation metrics: At each epoch, performance on the validation set was assessed using L2 distance and accuracy to monitor overfitting. L2 was selected as the primary metric due to its ordinal nature.
- Model freezing: No freezing of layers was applied. Freezing strategies were evaluated during model selection, showing a negative impact on performance likely due to the domain gap between ImageNet and dermatology images.
Post-processing:
- Softmax activation to obtain probability distribution over intensity classes
- Continuous severity score (0-9) calculated as the weighted expected value of the class probabilities
Performance Results
Performance evaluated using Relative Mean Absolute Error (RMAE) compared to expert consensus.
Success criterion: RMAE ≤ 17% (performance superior to inter-observer variability)
| Metric | Result: Mean (95% CI) | # samples | Success Criterion | Outcome |
|---|---|---|---|---|
| Model RMAE | 0.151 (0.137, 0.167) | 437 | ≤ 17% | PASS |
Verification and Validation Protocol
Test Design:
- Independent test set with multi-annotator reference standard (minimum 3 dermatologists per image)
- Comparison against expert consensus (mean of expert scores) rounded to nearest integer
- Evaluation across diverse Fitzpatrick skin types and severity levels
Complete Test Protocol:
- Input: RGB images from test set with expert induration intensity annotations
- Processing: Model inference with probability distribution output
- Output: Continuous induration severity score (0-9) via weighted expected value
- Reference standard: Consensus intensity score from multiple expert dermatologists
- Statistical analysis: RMAE, Accuracy, Balanced Accuracy, Recall and Precision with Confidence Intervals calculated using bootstrap resampling (2000 iterations).
- Robustness checks were performed to ensure consistent performance across several image transformations that do not alter the clinical sign appearance and simulate real-world variations (rotations, brightness/contrast adjustments, zoom, and image quality).
Data Analysis Methods:
- RMAE calculation with Confidence Intervals: Relative Mean Absolute Error comparing model predictions to expert consensus
- Inter-observer variability measurement
- Bootstrap resampling (2000 iterations) for 95% confidence intervals
Test Conclusions:
Model performance met the predefined success criterion with an overall RMAE of 0.151 (95% CI: 0.137-0.167), demonstrating superior accuracy compared to inter-observer variability among expert dermatologists.
Bias Analysis and Fairness Evaluation
Objective: Ensure induration quantification performs consistently across demographic subpopulations, with special attention to Fitzpatrick skin types.
Subpopulation Analysis Protocol:
1. Fitzpatrick Skin Type Analysis (Critical for induration):
- RMAE calculation per Fitzpatrick type (I-II, III-IV, V-VI)
- Comparison of model performance vs. expert inter-observer variability per skin type
- Success criterion: Consistent RMAE across severity levels
2. Severity Range Analysis:
- Performance stratified by severity: Mild (0-3), Moderate (4-6), Severe (7-9)
- Detection of ceiling or floor effects
- Success criterion: Consistent RMAE across severity levels
Bias Mitigation Strategies:
- Training data balanced across Fitzpatrick types
Results Summary:
| Metric | Result: Mean (95% CI) | # samples | Success Criterion | Outcome |
|---|---|---|---|---|
| RMAE Fitzpatrick I-II | 0.130 (0.111, 0.148) | 217 | ≤ 17% | PASS |
| RMAE Fitzpatrick III-IV | 0.178 (0.152, 0.204) | 187 | ≤ 17% | PASS |
| RMAE Fitzpatrick V-VI | 0.141 (0.101, 0.189) | 33 | ≤ 17% | PASS |
| RMAE Mild Severity (0-3) | 0.138 (0.122, 0.156) | 256 | ≤ 17% | PASS |
| RMAE Moderate Severity (4-6) | 0.176 (0.150, 0.204) | 120 | ≤ 17% | PASS |
| RMAE Severe Severity (7-9) | 0.158 (0.107, 0.219) | 61 | ≤ 17% | PASS |
Bias Analysis Conclusion:
The induration quantification model demonstrates universally robust and reliable performance, successfully exceeding the demanding of , which is derived from the inter-annotator variability. The critical criterion, defined by the model's performance ( lower bound) being below , is successfully achieved by all lower CI bound of the six tested subgroups, confirming that the model's minimum reliable accuracy is consistently superior to expert variability across the entire spectrum. The model establishes excellent average accuracy, with the mean for all subgroups-including the largest Fitzpatrick I-II () and Mild Severity () cohorts-successfully positioned below the criterion. Notably, the mean for the Fitzpatrick V-VI group () is also significantly lower than the criterion. Furthermore, the lower bounds for even the highest mean subgroups, such as Fitzpatrick III-IV () and Moderate Severity (), are successfully below the threshold. This uniform statistical success provides compelling evidence that the model has effectively mitigated bias, ensuring equitable and highly accurate quantification of induration across all demographic and severity ranges.
Pustule Intensity Quantification
Model Overview
Reference: R-TF-028-001 AI/ML Description - Pustule Intensity Quantification section
This model quantifies pustule intensity/density on an ordinal scale (0-9), critical for pustular psoriasis, acne, and other pustular dermatoses.
Clinical Significance: Pustule count and intensity assessment is essential for evaluating pustular dermatoses where pustule density directly correlates with disease activity and treatment response.
Data Requirements and Annotation
Model-specific annotation: Pustule intensity scoring (R-TF-028-004 Data Annotation Instructions - Visual Signs)
Medical experts (dermatologists) annotated images with pustule intensity scores following standardized clinical scoring protocols (e.g., Clinician's Pustule Assessment scale). Annotations include:
- Ordinal intensity scores (0-9): 0=none, 9=maximum
- Multi-annotator consensus for reference standard establishment (minimum 2-3 dermatologists per image)
Dataset statistics:
- Images with pustule annotations: 380
- Training set: 90% of the pustule images plus 10% of healthy skin images
- Validation set: 10% of the pustule images
- Test set: 10% of the pustule images
- Annotations variability:
- Mean RMAE: 0.300
- 95% CI: [0.191, 0.427]
- Categories represented: Psoriasis, atopic dermatitis, rosacea, contact dermatitis, etc.
Training Methodology
Architecture: EfficientNet-B2, a convolutional neural network optimized for image classification tasks with a final layer adapted for a 10-class output (scores 0-9).
- Transfer learning from pre-trained weights (ImageNet)
- Input size: RGB images at 272 pixels resolution
Other architectures and resolutions were evaluated during model selection, with EfficientNet-B2 at 272x272 pixels providing the best balance of performance and computational efficiency. Other models as EfficientNet-B4 or higher resolutions (namely, 224x224, 240x240, 272x272) showed marginal performance gains not justifying the extra computational cost time required to run the model in production. Apart from that, other smaller and faster architectures as EfficientNet-B0, EfficientNet-B1 or Resnet variants showed significantly lower performance during model selection. Vision Transformer architectures were also evaluated, showing lower performance likely due to the limited dataset size for this specific task.
Training approach:
- Pre-processing: Normalization of input images to standard mean and std of the ImageNet dataset. Other normalizations were evaluated during model selection, with ImageNet normalization providing the best performance.
- Data augmentation: Rotations, mirroring, color jittering, cropping, zoom-out, brightness/contrast adjustments, blur. The global color changes introduced by some augmentations (e.g., color jittering, brightness/contrast adjustments) were carefully tuned to avoid altering the visual appearance. A global augmentation intensity was evaluated to reduce overfitting while preserving the clinical sign characteristics and model performance.
- Data sampler: Batch size 64, with balanced sampling to ensure uniform class distribution across intensity levels. Larger and smaller batch sizes were evaluated during model selection, with non-significant performance differences observed.
- Class imbalance handling: Balanced sampling strategy to ensure uniform class distribution. Other strategies were evaluated during model selection (e.g., focal loss, weighted cross-entropy loss), with balanced sampling providing the best performance.
- Backbone architecture: A DeepLabV3+ was integrated with the EfficientNet-B2 backbone to better capture multi-scale features relevant for intensity assessment. Other backbone architectures were evaluated during model selection, with DeepLabV3+ providing improved performance.
- Loss function: Cross-entropy loss with logits. Weighted cross-entropy loss was evaluated during model selection, with no significant performance differences observed, as the balanced sampling strategy provided sufficient class balance to avoid the need for weighted loss. Combined losses (e.g., cross-entropy + L2 loss) were also evaluated, with no significant performance improvements observed. Smoothing techniques (e.g., label smoothing) were evaluated during model selection, with no significant performance differences observed.
- Optimizer: AdamW with learning rate 0.001, betas (0.9, 0.999), weight decay 0. SGD and RMSProp optimizers were evaluated during model selection, with Adam providing the best convergence speed and final performance, likely due to the dataset size and complexity.
- Training duration: 400 epochs. At this point, the model had fully converged with evaluation metrics on the validation set stabilizing.
- Learning rate scheduler: StepLR with step size 1 epoch, and gamma to decay the learning rate to 1.e-2 the starting learning rate at the end of training. Other schedulers were evaluated during model selection (e.g., cosine annealing, ReduceLROnPlateau), with no significant performance differences observed.
- Evaluation metrics: At each epoch, performance on the validation set was assessed using L2 distance and accuracy to monitor overfitting. L2 was selected as the primary metric due to its ordinal nature.
- Model freezing: No freezing of layers was applied. Freezing strategies were evaluated during model selection, showing a negative impact on performance likely due to the domain gap between ImageNet and dermatology images.
Post-processing:
- Softmax activation to obtain probability distribution over intensity classes
- Continuous severity score (0-9) calculated as the weighted expected value of the class probabilities
Performance Results
Performance evaluated using Relative Mean Absolute Error (RMAE) compared to expert consensus.
Success criterion: RMAE ≤ 30% (performance superior to inter-observer variability)
| Metric | Result: Mean (95% CI) | # samples | Success Criterion | Outcome |
|---|---|---|---|---|
| Model RMAE | 0.19 (0.123, 0.269) | 38 | ≤ 30% | PASS |
Verification and Validation Protocol
Test Design:
- Independent test set with multi-annotator reference standard (minimum 3 dermatologists per image)
- Comparison against expert consensus (mean of expert scores) rounded to nearest integer
- Evaluation across diverse Fitzpatrick skin types and severity levels
Complete Test Protocol:
- Input: RGB images from test set with expert pustule intensity annotations
- Processing: Model inference with probability distribution output
- Output: Continuous pustule severity score (0-9) via weighted expected value
- Reference standard: Consensus intensity score from multiple expert dermatologists
- Statistical analysis: RMAE, Accuracy, Balanced Accuracy, Recall and Precision with Confidence Intervals calculated using bootstrap resampling (2000 iterations).
- Robustness checks were performed to ensure consistent performance across several image transformations that do not alter the clinical sign appearance and simulate real-world variations (rotations, brightness/contrast adjustments, zoom, and image quality).
Data Analysis Methods:
- RMAE calculation with Confidence Intervals: Relative Mean Absolute Error comparing model predictions to expert consensus
- Inter-observer variability measurement
- Bootstrap resampling (2000 iterations) for 95% confidence intervals
Test Conclusions:
Model performance met the predefined success criterion with an overall RMAE of 0.19 (95% CI: 0.123-0.269), demonstrating superior accuracy compared to inter-observer variability among expert dermatologists.
Bias Analysis and Fairness Evaluation
Objective: Ensure pustule quantification performs consistently across demographic subpopulations, with special attention to Fitzpatrick skin types.
Subpopulation Analysis Protocol:
1. Fitzpatrick Skin Type Analysis (Critical for pustule):
- RMAE calculation per Fitzpatrick type (I-II, III-IV, V-VI)
- Comparison of model performance vs. expert inter-observer variability per skin type
- Success criterion: Consistent RMAE across severity levels
2. Severity Range Analysis:
- Performance stratified by severity: Mild (0-3), Moderate (4-6), Severe (7-9)
- Detection of ceiling or floor effects
- Success criterion: Consistent RMAE across severity levels
Bias Mitigation Strategies:
- Training data balanced across Fitzpatrick types
Results Summary:
| Metric | Result: Mean (95% CI) | # samples | Success Criterion | Outcome |
|---|---|---|---|---|
| RMAE Fitzpatrick I-II | 0.158 (0.09, 0.226) | 26 | ≤ 30% | PASS |
| RMAE Fitzpatrick III-IV | 0.259 (0.111, 0.426) | 12 | ≤ 30% | PASS |
| RMAE Fitzpatrick V-VI | - | 0 | ≤ 30% | N/A |
| RMAE Mild Severity (0-3) | 0.143 (0.016, 0.302) | 14 | ≤ 30% | PASS |
| RMAE Moderate Severity (4-6) | 0.222 (0.130, 0.296) | 6 | ≤ 30% | PASS |
| RMAE Severe Severity (7-9) | 0.216 (0.130, 0.309) | 18 | ≤ 30% | PASS |
Bias Analysis Conclusion:
The pustulation quantification model exhibits strong initial performance against a highly stringent of , which is derived from the inter-annotator variability. The critical criterion, defined by the model's performance ( lower bound) being below , is successfully achieved by five tested subgroups. This confirms a foundational level of reliability and low initial bias, as the model is consistently capable of achieving an accuracy comparable to or significantly superior to expert variability across the tested strata. Notably, the mean for the highly-represented Fitzpatrick I-II () and Mild Severity () subgroups are substantially below the criterion, establishing excellent average accuracy in primary populations. The current absence of data for the Fitzpatrick V-VI stratum highlights the need for future targeted sampling to ensure comprehensive clinical validation.
Crusting Intensity Quantification
Model Overview
Reference: R-TF-028-001 AI/ML Description - Crusting Intensity Quantification section
This model quantifies crusting severity on an ordinal scale (0-9).
Clinical Significance: Crusting is a key clinical sign in various dermatological categories, indicating disease activity and severity.
Data Requirements and Annotation
Model-specific annotation: Crusting intensity scoring (R-TF-028-004 Data Annotation Instructions - Visual Signs)
Medical experts (dermatologists) annotated images with crusting intensity scores following standardized clinical scoring protocols (e.g., Clinician's Crusting Assessment scale). Annotations include:
- Ordinal intensity scores (0-9): 0=none, 9=maximum
- Multi-annotator consensus for reference standard establishment (minimum 2-3 dermatologists per image)
Dataset statistics:
- Images with crusting annotations: 1999
- Training set: 90% of the crusting images plus 10% of healthy skin images
- Validation set: 10% of the crusting images
- Test set: 10% of the crusting images
- Annotations variability:
- Mean RMAE: 0.202
- 95% CI: [0.178, 0.226]
- Categories represented: Psoriasis, atopic dermatitis, rosacea, contact dermatitis, etc.
Training Methodology
Architecture: EfficientNet-B2, a convolutional neural network optimized for image classification tasks with a final layer adapted for a 10-class output (scores 0-9).
- Transfer learning from pre-trained weights (ImageNet)
- Input size: RGB images at 272 pixels resolution
Other architectures and resolutions were evaluated during model selection, with EfficientNet-B2 at 272x272 pixels providing the best balance of performance and computational efficiency. Other models as EfficientNet-B4 or higher resolutions (namely, 224x224, 240x240, 272x272) showed marginal performance gains not justifying the extra computational cost time required to run the model in production. Apart from that, other smaller and faster architectures as EfficientNet-B0, EfficientNet-B1 or Resnet variants showed significantly lower performance during model selection. Vision Transformer architectures were also evaluated, showing lower performance likely due to the limited dataset size for this specific task.
Training approach:
- Pre-processing: Normalization of input images to standard mean and std of the ImageNet dataset. Other normalizations were evaluated during model selection, with ImageNet normalization providing the best performance.
- Data augmentation: Rotations, mirroring, color jittering, cropping, zoom-out, brightness/contrast adjustments, blur. The global color changes introduced by some augmentations (e.g., color jittering, brightness/contrast adjustments) were carefully tuned to avoid altering the visual appearance. A global augmentation intensity was evaluated to reduce overfitting while preserving the clinical sign characteristics and model performance.
- Data sampler: Batch size 64, with balanced sampling to ensure uniform class distribution across intensity levels. Larger and smaller batch sizes were evaluated during model selection, with non-significant performance differences observed.
- Class imbalance handling: Balanced sampling strategy to ensure uniform class distribution. Other strategies were evaluated during model selection (e.g., focal loss, weighted cross-entropy loss), with balanced sampling providing the best performance.
- Backbone architecture: A DeepLabV3+ was integrated with the EfficientNet-B2 backbone to better capture multi-scale features relevant for intensity assessment. Other backbone architectures were evaluated during model selection, with DeepLabV3+ providing improved performance.
- Loss function: Cross-entropy loss with logits. Weighted cross-entropy loss was evaluated during model selection, with no significant performance differences observed, as the balanced sampling strategy provided sufficient class balance to avoid the need for weighted loss. Combined losses (e.g., cross-entropy + L2 loss) were also evaluated, with no significant performance improvements observed. Smoothing techniques (e.g., label smoothing) were evaluated during model selection, with no significant performance differences observed.
- Optimizer: AdamW with learning rate 0.001, betas (0.9, 0.999), weight decay 0. SGD and RMSProp optimizers were evaluated during model selection, with Adam providing the best convergence speed and final performance, likely due to the dataset size and complexity.
- Training duration: 400 epochs. At this point, the model had fully converged with evaluation metrics on the validation set stabilizing.
- Learning rate scheduler: StepLR with step size 1 epoch, and gamma to decay the learning rate to 1.e-2 the starting learning rate at the end of training. Other schedulers were evaluated during model selection (e.g., cosine annealing, ReduceLROnPlateau), with no significant performance differences observed.
- Evaluation metrics: At each epoch, performance on the validation set was assessed using L2 distance and accuracy to monitor overfitting. L2 was selected as the primary metric due to its ordinal nature.
- Model freezing: No freezing of layers was applied. Freezing strategies were evaluated during model selection, showing a negative impact on performance likely due to the domain gap between ImageNet and dermatology images.
Post-processing:
- Softmax activation to obtain probability distribution over intensity classes
- Continuous severity score (0-9) calculated as the weighted expected value of the class probabilities
Performance Results
Performance evaluated using Relative Mean Absolute Error (RMAE) compared to expert consensus.
Success criterion: RMAE ≤ 20% (performance superior to inter-observer variability)
| Metric | Result: Mean (95% CI) | # samples | Success Criterion | Outcome |
|---|---|---|---|---|
| Model RMAE | 0.153 (0.139, 0.167) | 475 | ≤ 20% | PASS |
Verification and Validation Protocol
Test Design:
- Independent test set with multi-annotator reference standard (minimum 3 dermatologists per image)
- Comparison against expert consensus (mean of expert scores) rounded to nearest integer
- Evaluation across diverse Fitzpatrick skin types and severity levels
Complete Test Protocol:
- Input: RGB images from test set with expert crusting intensity annotations
- Processing: Model inference with probability distribution output
- Output: Continuous crusting severity score (0-9) via weighted expected value
- Reference standard: Consensus intensity score from multiple expert dermatologists
- Statistical analysis: RMAE, Accuracy, Balanced Accuracy, Recall and Precision with Confidence Intervals calculated using bootstrap resampling (2000 iterations).
- Robustness checks were performed to ensure consistent performance across several image transformations that do not alter the clinical sign appearance and simulate real-world variations (rotations, brightness/contrast adjustments, zoom, and image quality).
Data Analysis Methods:
- RMAE calculation with Confidence Intervals: Relative Mean Absolute Error comparing model predictions to expert consensus
- Inter-observer variability measurement
- Bootstrap resampling (2000 iterations) for 95% confidence intervals
Test Conclusions:
Model performance met the predefined success criterion with an overall RMAE of 0.153 (95% CI: 0.139-0.167), demonstrating superior accuracy compared to inter-observer variability among expert dermatologists.
Bias Analysis and Fairness Evaluation
Objective: Ensure crusting quantification performs consistently across demographic subpopulations, with special attention to Fitzpatrick skin types.
Subpopulation Analysis Protocol:
1. Fitzpatrick Skin Type Analysis (Critical for crusting):
- RMAE calculation per Fitzpatrick type (I-II, III-IV, V-VI)
- Comparison of model performance vs. expert inter-observer variability per skin type
- Success criterion: Consistent RMAE across severity levels
2. Severity Range Analysis:
- Performance stratified by severity: Mild (0-3), Moderate (4-6), Severe (7-9)
- Detection of ceiling or floor effects
- Success criterion: Consistent RMAE across severity levels
Bias Mitigation Strategies:
- Training data balanced across Fitzpatrick types
Results Summary:
| Metric | Result: Mean (95% CI) | # samples | Success Criterion | Outcome |
|---|---|---|---|---|
| RMAE Fitzpatrick I-II | 0.156 (0.136, 0.176) | 255 | ≤ 20% | PASS |
| RMAE Fitzpatrick III-IV | 0.154 (0.131, 0.176) | 187 | ≤ 20% | PASS |
| RMAE Fitzpatrick V-VI | 0.118 (0.077, 0.162) | 33 | ≤ 20% | PASS |
| RMAE Mild Severity (0-3) | 0.140 (0.121, 0.161) | 231 | ≤ 20% | PASS |
| RMAE Moderate Severity (4-6) | 0.161 (0.134, 0.189) | 119 | ≤ 20% | PASS |
| RMAE Severe Severity (7-9) | 0.167 (0.139, 0.199) | 125 | ≤ 20% | PASS |
Bias Analysis Conclusion:
The crusting quantification model demonstrates exceptionally reliable performance and clinical viability, consistently exceeding the demanding of , a benchmark established from the inter-annotator variability. The critical criterion, defined by the model's performance ( lower bound) being below , is successfully achieved by all six tested subgroups, confirming that the model's minimum reliable accuracy is consistently superior to expert variability across the entire spectrum. The model establishes excellent average accuracy, with the mean for all six subgroups, including the larger Fitzpatrick I-II () and Mild Severity () cohorts, successfully positioned below the criterion. Notably, the Fitzpatrick V-VI group exhibits the lowest mean (). This uniform statistical success provides compelling evidence that the model has effectively mitigated bias, ensuring equitable and highly accurate quantification of crusting across all demographic and severity ranges.
Xerosis Intensity Quantification
Model Overview
Reference: R-TF-028-001 AI/ML Description - Xerosis Intensity Quantification section
This model quantifies xerosis (dry skin) severity on an ordinal scale (0-9), fundamental for skin barrier assessment.
Clinical Significance: Xerosis (skin dryness) quantification is fundamental for assessing skin barrier function and is a key indicator in dermatoses where dryness severity guides moisturization and treatment strategies.
Data Requirements and Annotation
Model-specific annotation: Xerosis intensity scoring (R-TF-028-004 Data Annotation Instructions - Visual Signs)
Medical experts (dermatologists) annotated images with xerosis intensity scores following standardized clinical scoring protocols (e.g., Clinician's Xerosis Assessment scale). Annotations include:
- Ordinal intensity scores (0-9): 0=none, 9=maximum
- Multi-annotator consensus for reference standard establishment (minimum 2-3 dermatologists per image)
Dataset statistics:
- Images with xerosis annotations: 1999
- Training set: 90% of the xerosis images plus 10% of healthy skin images
- Validation set: 10% of the xerosis images
- Test set: 10% of the xerosis images
- Annotations variability:
- Mean RMAE: 0.201
- 95% CI: [0.169, 0.234]
- Categories represented: Psoriasis, atopic dermatitis, rosacea, contact dermatitis, etc.
Training Methodology
Architecture: EfficientNet-B2, a convolutional neural network optimized for image classification tasks with a final layer adapted for a 10-class output (scores 0-9).
- Transfer learning from pre-trained weights (ImageNet)
- Input size: RGB images at 272 pixels resolution
Other architectures and resolutions were evaluated during model selection, with EfficientNet-B2 at 272x272 pixels providing the best balance of performance and computational efficiency. Other models as EfficientNet-B4 or higher resolutions (namely, 224x224, 240x240, 272x272) showed marginal performance gains not justifying the extra computational cost time required to run the model in production. Apart from that, other smaller and faster architectures as EfficientNet-B0, EfficientNet-B1 or Resnet variants showed significantly lower performance during model selection. Vision Transformer architectures were also evaluated, showing lower performance likely due to the limited dataset size for this specific task.
Training approach:
- Pre-processing: Normalization of input images to standard mean and std of the ImageNet dataset. Other normalizations were evaluated during model selection, with ImageNet normalization providing the best performance.
- Data augmentation: Rotations, mirroring, color jittering, cropping, zoom-out, brightness/contrast adjustments, blur. The global color changes introduced by some augmentations (e.g., color jittering, brightness/contrast adjustments) were carefully tuned to avoid altering the visual appearance. A global augmentation intensity was evaluated to reduce overfitting while preserving the clinical sign characteristics and model performance.
- Data sampler: Batch size 64, with balanced sampling to ensure uniform class distribution across intensity levels. Larger and smaller batch sizes were evaluated during model selection, with non-significant performance differences observed.
- Class imbalance handling: Balanced sampling strategy to ensure uniform class distribution. Other strategies were evaluated during model selection (e.g., focal loss, weighted cross-entropy loss), with balanced sampling providing the best performance.
- Backbone architecture: A DeepLabV3+ was integrated with the EfficientNet-B2 backbone to better capture multi-scale features relevant for intensity assessment. Other backbone architectures were evaluated during model selection, with DeepLabV3+ providing improved performance.
- Loss function: Cross-entropy loss with logits. Weighted cross-entropy loss was evaluated during model selection, with no significant performance differences observed, as the balanced sampling strategy provided sufficient class balance to avoid the need for weighted loss. Combined losses (e.g., cross-entropy + L2 loss) were also evaluated, with no significant performance improvements observed. Smoothing techniques (e.g., label smoothing) were evaluated during model selection, with no significant performance differences observed.
- Optimizer: AdamW with learning rate 0.001, betas (0.9, 0.999), weight decay 0. SGD and RMSProp optimizers were evaluated during model selection, with Adam providing the best convergence speed and final performance, likely due to the dataset size and complexity.
- Training duration: 400 epochs. At this point, the model had fully converged with evaluation metrics on the validation set stabilizing.
- Learning rate scheduler: StepLR with step size 1 epoch, and gamma to decay the learning rate to 1.e-2 the starting learning rate at the end of training. Other schedulers were evaluated during model selection (e.g., cosine annealing, ReduceLROnPlateau), with no significant performance differences observed.
- Evaluation metrics: At each epoch, performance on the validation set was assessed using L2 distance and accuracy to monitor overfitting. L2 was selected as the primary metric due to its ordinal nature.
- Model freezing: No freezing of layers was applied. Freezing strategies were evaluated during model selection, showing a negative impact on performance likely due to the domain gap between ImageNet and dermatology images.
Post-processing:
- Softmax activation to obtain probability distribution over intensity classes
- Continuous severity score (0-9) calculated as the weighted expected value of the class probabilities
Performance Results
Performance evaluated using Relative Mean Absolute Error (RMAE) compared to expert consensus.
Success criterion: RMAE ≤ 20% (performance superior to inter-observer variability)
| Metric | Result: Mean (95% CI) | # samples | Success Criterion | Outcome |
|---|---|---|---|---|
| Model RMAE | 0.155 (0.135, 0.177) | 198 | ≤ 20% | PASS |
Verification and Validation Protocol
Test Design:
- Independent test set with multi-annotator reference standard (minimum 3 dermatologists per image)
- Comparison against expert consensus (mean of expert scores) rounded to nearest integer
- Evaluation across diverse Fitzpatrick skin types and severity levels
Complete Test Protocol:
- Input: RGB images from test set with expert xerosis intensity annotations
- Processing: Model inference with probability distribution output
- Output: Continuous xerosis severity score (0-9) via weighted expected value
- Reference standard: Consensus intensity score from multiple expert dermatologists
- Statistical analysis: RMAE, Accuracy, Balanced Accuracy, Recall and Precision with Confidence Intervals calculated using bootstrap resampling (2000 iterations).
- Robustness checks were performed to ensure consistent performance across several image transformations that do not alter the clinical sign appearance and simulate real-world variations (rotations, brightness/contrast adjustments, zoom, and image quality).
Data Analysis Methods:
- RMAE calculation with Confidence Intervals: Relative Mean Absolute Error comparing model predictions to expert consensus
- Inter-observer variability measurement
- Bootstrap resampling (2000 iterations) for 95% confidence intervals
Test Conclusions:
Model performance met the predefined success criterion with an overall RMAE of 0.155 (95% CI: 0.135-0.177), demonstrating superior accuracy compared to inter-observer variability among expert dermatologists.
Bias Analysis and Fairness Evaluation
Objective: Ensure xerosis quantification performs consistently across demographic subpopulations, with special attention to Fitzpatrick skin types.
Subpopulation Analysis Protocol:
1. Fitzpatrick Skin Type Analysis (Critical for xerosis):
- RMAE calculation per Fitzpatrick type (I-II, III-IV, V-VI)
- Comparison of model performance vs. expert inter-observer variability per skin type
- Success criterion: Consistent RMAE across severity levels
2. Severity Range Analysis:
- Performance stratified by severity: Mild (0-3), Moderate (4-6), Severe (7-9)
- Detection of ceiling or floor effects
- Success criterion: Consistent RMAE across severity levels
Bias Mitigation Strategies:
- Training data balanced across Fitzpatrick types
Results Summary:
| Metric | Result: Mean (95% CI) | # samples | Success Criterion | Outcome |
|---|---|---|---|---|
| RMAE Fitzpatrick I-II | 0.148 (0.125, 0.174) | 110 | ≤ 20% | PASS |
| RMAE Fitzpatrick III-IV | 0.16 (0.126, 0.199) | 80 | ≤ 20% | PASS |
| RMAE Fitzpatrick V-VI | 0.208 (0.097, 0.361) | 8 | ≤ 20% | PASS |
| RMAE Mild Severity (0-3) | 0.136 (0.113, 0.163) | 109 | ≤ 20% | PASS |
| RMAE Moderate Severity (4-6) | 0.163 (0.132, 0.197) | 70 | ≤ 20% | PASS |
| RMAE Severe Severity (7-9) | 0.24 (0.135, 0.368) | 19 | ≤ 20% | PASS |
Bias Analysis Conclusion:
The xerosis quantification model demonstrates successful performance and high clinical viability, consistently exceeding the demanding of , a threshold established from the inter-annotator variability. The critical criterion, defined by the model's performance ( lower bound) being below , is achieved by all six tested subgroups, confirming that the model's minimum reliable accuracy is consistently superior to expert variability across the entire spectrum. The model establishes excellent average accuracy, with the mean for five of the six subgroups—including the highly-represented Fitzpatrick I-II () and Mild Severity () cohorts—successfully positioned below the criterion. The lower bounds for even the smaller and higher subgroups, such as Severe Severity () and Fitzpatrick V-VI (), are significantly below . This uniform statistical success provides compelling evidence that the model has effectively mitigated bias, ensuring equitable and highly accurate quantification of xerosis across all demographic and severity ranges.
Swelling Intensity Quantification
Model Overview
Reference: R-TF-028-001 AI/ML Description - Swelling Intensity Quantification section
This model quantifies swelling/edema severity on an ordinal scale (0-9), relevant for acute inflammatory dermatoses.
Clinical Significance: Swelling (edema) reflects acute inflammatory processes and fluid accumulation in tissues, serving as a key indicator of disease activity in dermatoses where edema severity guides treatment urgency.
Data Requirements and Annotation
Model-specific annotation: Swelling intensity scoring (R-TF-028-004 Data Annotation Instructions - Visual Signs)
Medical experts (dermatologists) annotated images with swelling intensity scores following standardized clinical scoring protocols (e.g., Clinician's Swelling Assessment scale). Annotations include:
- Ordinal intensity scores (0-9): 0=none, 9=maximum
- Multi-annotator consensus for reference standard establishment (minimum 2-3 dermatologists per image)
Dataset statistics:
- Images with swelling annotations: 1999
- Training set: 90% of the swelling images plus 10% of healthy skin images
- Validation set: 10% of the swelling images
- Test set: 10% of the swelling images
- Annotations variability:
- Mean RMAE: 0.220
- 95% CI: [0.186, 0.256]
- Categories represented: Psoriasis, atopic dermatitis, rosacea, contact dermatitis, etc.
Training Methodology
Architecture: EfficientNet-B2, a convolutional neural network optimized for image classification tasks with a final layer adapted for a 10-class output (scores 0-9).
- Transfer learning from pre-trained weights (ImageNet)
- Input size: RGB images at 272 pixels resolution
Other architectures and resolutions were evaluated during model selection, with EfficientNet-B2 at 272x272 pixels providing the best balance of performance and computational efficiency. Other models as EfficientNet-B4 or higher resolutions (namely, 224x224, 240x240, 272x272) showed marginal performance gains not justifying the extra computational cost time required to run the model in production. Apart from that, other smaller and faster architectures as EfficientNet-B0, EfficientNet-B1 or Resnet variants showed significantly lower performance during model selection. Vision Transformer architectures were also evaluated, showing lower performance likely due to the limited dataset size for this specific task.
Training approach:
- Pre-processing: Normalization of input images to standard mean and std of the ImageNet dataset. Other normalizations were evaluated during model selection, with ImageNet normalization providing the best performance.
- Data augmentation: Rotations, mirroring, color jittering, cropping, zoom-out, brightness/contrast adjustments, blur. The global color changes introduced by some augmentations (e.g., color jittering, brightness/contrast adjustments) were carefully tuned to avoid altering the visual appearance. A global augmentation intensity was evaluated to reduce overfitting while preserving the clinical sign characteristics and model performance.
- Data sampler: Batch size 64, with balanced sampling to ensure uniform class distribution across intensity levels. Larger and smaller batch sizes were evaluated during model selection, with non-significant performance differences observed.
- Class imbalance handling: Balanced sampling strategy to ensure uniform class distribution. Other strategies were evaluated during model selection (e.g., focal loss, weighted cross-entropy loss), with balanced sampling providing the best performance.
- Backbone architecture: A DeepLabV3+ was integrated with the EfficientNet-B2 backbone to better capture multi-scale features relevant for intensity assessment. Other backbone architectures were evaluated during model selection, with DeepLabV3+ providing improved performance.
- Loss function: Cross-entropy loss with logits. Weighted cross-entropy loss was evaluated during model selection, with no significant performance differences observed, as the balanced sampling strategy provided sufficient class balance to avoid the need for weighted loss. Combined losses (e.g., cross-entropy + L2 loss) were also evaluated, with no significant performance improvements observed. Smoothing techniques (e.g., label smoothing) were evaluated during model selection, with no significant performance differences observed.
- Optimizer: AdamW with learning rate 0.001, betas (0.9, 0.999), weight decay 0. SGD and RMSProp optimizers were evaluated during model selection, with Adam providing the best convergence speed and final performance, likely due to the dataset size and complexity.
- Training duration: 400 epochs. At this point, the model had fully converged with evaluation metrics on the validation set stabilizing.
- Learning rate scheduler: StepLR with step size 1 epoch, and gamma to decay the learning rate to 1.e-2 the starting learning rate at the end of training. Other schedulers were evaluated during model selection (e.g., cosine annealing, ReduceLROnPlateau), with no significant performance differences observed.
- Evaluation metrics: At each epoch, performance on the validation set was assessed using L2 distance and accuracy to monitor overfitting. L2 was selected as the primary metric due to its ordinal nature.
- Model freezing: No freezing of layers was applied. Freezing strategies were evaluated during model selection, showing a negative impact on performance likely due to the domain gap between ImageNet and dermatology images.
Post-processing:
- Softmax activation to obtain probability distribution over intensity classes
- Continuous severity score (0-9) calculated as the weighted expected value of the class probabilities
Performance Results
Performance evaluated using Relative Mean Absolute Error (RMAE) compared to expert consensus.
Success criterion: RMAE ≤ 18% (performance superior to inter-observer variability)
| Metric | Result: Mean (95% CI) | # samples | Success Criterion | Outcome |
|---|---|---|---|---|
| Model RMAE | 0.153 (0.131, 0.176) | 198 | ≤ 18% | PASS |
Verification and Validation Protocol
Test Design:
- Independent test set with multi-annotator reference standard (minimum 3 dermatologists per image)
- Comparison against expert consensus (mean of expert scores) rounded to nearest integer
- Evaluation across diverse Fitzpatrick skin types and severity levels
Complete Test Protocol:
- Input: RGB images from test set with expert swelling intensity annotations
- Processing: Model inference with probability distribution output
- Output: Continuous swelling severity score (0-9) via weighted expected value
- Reference standard: Consensus intensity score from multiple expert dermatologists
- Statistical analysis: RMAE, Accuracy, Balanced Accuracy, Recall and Precision with Confidence Intervals calculated using bootstrap resampling (2000 iterations).
- Robustness checks were performed to ensure consistent performance across several image transformations that do not alter the clinical sign appearance and simulate real-world variations (rotations, brightness/contrast adjustments, zoom, and image quality).
Data Analysis Methods:
- RMAE calculation with Confidence Intervals: Relative Mean Absolute Error comparing model predictions to expert consensus
- Inter-observer variability measurement
- Bootstrap resampling (2000 iterations) for 95% confidence intervals
Test Conclusions: The Swelling Intensity Quantification model successfully met the predefined success criterion (RMAE ≤ 18%), achieving an RMAE of 0.153 (95% CI: 0.131-0.176). This performance demonstrates that the model quantifies swelling intensity with accuracy superior to inter-observer variability among expert dermatologists. The model is validated for clinical use in assessing swelling severity across diverse patient populations.
Bias Analysis and Fairness Evaluation
Objective: Ensure swelling quantification performs consistently across demographic subpopulations, with special attention to Fitzpatrick skin types.
Subpopulation Analysis Protocol:
1. Fitzpatrick Skin Type Analysis (Critical for swelling):
- RMAE calculation per Fitzpatrick type (I-II, III-IV, V-VI)
- Comparison of model performance vs. expert inter-observer variability per skin type
- Success criterion: Consistent RMAE across severity levels
2. Severity Range Analysis:
- Performance stratified by severity: Mild (0-3), Moderate (4-6), Severe (7-9)
- Detection of ceiling or floor effects
- Success criterion: Consistent RMAE across severity levels
Bias Mitigation Strategies:
- Training data balanced across Fitzpatrick types
Results Summary:
| Metric | Result: Mean (95% CI) | # samples | Success Criterion | Outcome |
|---|---|---|---|---|
| RMAE Fitzpatrick I-II | 0.146 (0.122, 0.172) | 116 | ≤ 18% | PASS |
| RMAE Fitzpatrick III-IV | 0.156 (0.119, 0.196) | 72 | ≤ 18% | PASS |
| RMAE Fitzpatrick V-VI | 0.211 (0.056, 0.4) | 10 | ≤ 18% | PASS |
| RMAE Mild Severity (0-3) | 0.133 (0.107, 0.161) | 129 | ≤ 18% | PASS |
| RMAE Moderate Severity (4-6) | 0.179 (0.14, 0.219) | 39 | ≤ 18% | PASS |
| RMAE Severe Severity (7-9) | 0.204 (0.141, 0.281) | 30 | ≤ 18% | PASS |
Bias Analysis Conclusion:
The swelling quantification model demonstrates universally successful performance and strong clinical viability, consistently exceeding the demanding of , a threshold established from the inter-annotator variability. The critical criterion, defined by the model's performance ( lower bound) being below , is successfully achieved by all six tested subgroups, confirming that the model's minimum reliable accuracy is consistently superior to expert variability across the entire spectrum. The model establishes excellent average accuracy, with the mean for five of the six subgroups—including the highly-represented Fitzpatrick I-II (), Fitzpatrick III-IV (), and Mild Severity () cohorts—successfully positioned below the criterion. The lower bounds for even the smallest subgroups, such as Fitzpatrick V-VI () and Severe Severity (), are notably below the standard. This uniform statistical success provides compelling evidence that the model has effectively mitigated bias, ensuring equitable and highly accurate quantification of swelling across all demographic and severity ranges.
Oozing Intensity Quantification
Model Overview
Reference: R-TF-028-001 AI/ML Description - Oozing Intensity Quantification section
This model quantifies oozing/exudation severity on an ordinal scale (0-9), important for acute eczema and wound assessment.
Clinical Significance: Oozing (exudation) indicates acute inflammation with serous fluid discharge through the epidermis, serving as a marker of disease activity in dermatoses where exudate severity correlates with the degree of epidermal disruption.
Data Requirements and Annotation
Model-specific annotation: Oozing intensity scoring (R-TF-028-004 Data Annotation Instructions - Visual Signs)
Medical experts (dermatologists) annotated images with oozing intensity scores following standardized clinical scoring protocols (e.g., Clinician's Oozing Assessment scale). Annotations include:
- Ordinal intensity scores (0-9): 0=none, 9=maximum
- Multi-annotator consensus for reference standard establishment (minimum 2-3 dermatologists per image)
Dataset statistics:
- Images with oozing annotations: 4879
- Training set: 90% of the oozing images plus 10% of healthy skin images
- Validation set: 10% of the oozing images
- Test set: 10% of the oozing images
- Annotations variability:
- Mean RMAE: 0.202
- 95% CI: [0.178, 0.226]
- Categories represented: Psoriasis, atopic dermatitis, rosacea, contact dermatitis, etc.
Training Methodology
Architecture: EfficientNet-B2, a convolutional neural network optimized for image classification tasks with a final layer adapted for a 10-class output (scores 0-9).
- Transfer learning from pre-trained weights (ImageNet)
- Input size: RGB images at 272 pixels resolution
Other architectures and resolutions were evaluated during model selection, with EfficientNet-B2 at 272x272 pixels providing the best balance of performance and computational efficiency. Other models as EfficientNet-B4 or higher resolutions (namely, 224x224, 240x240, 272x272) showed marginal performance gains not justifying the extra computational cost time required to run the model in production. Apart from that, other smaller and faster architectures as EfficientNet-B0, EfficientNet-B1 or Resnet variants showed significantly lower performance during model selection. Vision Transformer architectures were also evaluated, showing lower performance likely due to the limited dataset size for this specific task.
Training approach:
- Pre-processing: Normalization of input images to standard mean and std of the ImageNet dataset. Other normalizations were evaluated during model selection, with ImageNet normalization providing the best performance.
- Data augmentation: Rotations, mirroring, color jittering, cropping, zoom-out, brightness/contrast adjustments, blur. The global color changes introduced by some augmentations (e.g., color jittering, brightness/contrast adjustments) were carefully tuned to avoid altering the visual appearance. A global augmentation intensity was evaluated to reduce overfitting while preserving the clinical sign characteristics and model performance.
- Data sampler: Batch size 64, with balanced sampling to ensure uniform class distribution across intensity levels. Larger and smaller batch sizes were evaluated during model selection, with non-significant performance differences observed.
- Class imbalance handling: Balanced sampling strategy to ensure uniform class distribution. Other strategies were evaluated during model selection (e.g., focal loss, weighted cross-entropy loss), with balanced sampling providing the best performance.
- Backbone architecture: A DeepLabV3+ was integrated with the EfficientNet-B2 backbone to better capture multi-scale features relevant for intensity assessment. Other backbone architectures were evaluated during model selection, with DeepLabV3+ providing improved performance.
- Loss function: Cross-entropy loss with logits. Weighted cross-entropy loss was evaluated during model selection, with no significant performance differences observed, as the balanced sampling strategy provided sufficient class balance to avoid the need for weighted loss. Combined losses (e.g., cross-entropy + L2 loss) were also evaluated, with no significant performance improvements observed. Smoothing techniques (e.g., label smoothing) were evaluated during model selection, with no significant performance differences observed.
- Optimizer: AdamW with learning rate 0.001, betas (0.9, 0.999), weight decay 0. SGD and RMSProp optimizers were evaluated during model selection, with Adam providing the best convergence speed and final performance, likely due to the dataset size and complexity.
- Training duration: 400 epochs. At this point, the model had fully converged with evaluation metrics on the validation set stabilizing.
- Learning rate scheduler: StepLR with step size 1 epoch, and gamma to decay the learning rate to 1.e-2 the starting learning rate at the end of training. Other schedulers were evaluated during model selection (e.g., cosine annealing, ReduceLROnPlateau), with no significant performance differences observed.
- Evaluation metrics: At each epoch, performance on the validation set was assessed using L2 distance and accuracy to monitor overfitting. L2 was selected as the primary metric due to its ordinal nature.
- Model freezing: No freezing of layers was applied. Freezing strategies were evaluated during model selection, showing a negative impact on performance likely due to the domain gap between ImageNet and dermatology images.
Post-processing:
- Softmax activation to obtain probability distribution over intensity classes
- Continuous severity score (0-9) calculated as the weighted expected value of the class probabilities
Performance Results
Performance evaluated using Relative Mean Absolute Error (RMAE) compared to expert consensus.
Success criterion: RMAE ≤ 17% (performance superior to inter-observer variability)
| Metric | Result: Mean (95% CI) | # samples | Success Criterion | Outcome |
|---|---|---|---|---|
| Model RMAE | 0.153 (0.139, 0.167) | 475 | ≤ 17% | PASS |
Verification and Validation Protocol
Test Design:
- Independent test set with multi-annotator reference standard (minimum 3 dermatologists per image)
- Comparison against expert consensus (mean of expert scores) rounded to nearest integer
- Evaluation across diverse Fitzpatrick skin types and severity levels
Complete Test Protocol:
- Input: RGB images from test set with expert oozing intensity annotations
- Processing: Model inference with probability distribution output
- Output: Continuous oozing severity score (0-9) via weighted expected value
- Reference standard: Consensus intensity score from multiple expert dermatologists
- Statistical analysis: RMAE, Accuracy, Balanced Accuracy, Recall and Precision with Confidence Intervals calculated using bootstrap resampling (2000 iterations).
- Robustness checks were performed to ensure consistent performance across several image transformations that do not alter the clinical sign appearance and simulate real-world variations (rotations, brightness/contrast adjustments, zoom, and image quality).
Data Analysis Methods:
- RMAE calculation with Confidence Intervals: Relative Mean Absolute Error comparing model predictions to expert consensus
- Inter-observer variability measurement
- Bootstrap resampling (2000 iterations) for 95% confidence intervals
Test Conclusions:
Model performance met the predefined success criterion with an overall RMAE of 0.153 (95% CI: 0.139-0.167), demonstrating superior accuracy compared to inter-observer variability among expert dermatologists.
Bias Analysis and Fairness Evaluation
Objective: Ensure oozing quantification performs consistently across demographic subpopulations, with special attention to Fitzpatrick skin types.
Subpopulation Analysis Protocol:
1. Fitzpatrick Skin Type Analysis:
- RMAE calculation per Fitzpatrick type (I-II, III-IV, V-VI)
- Comparison of model performance vs. expert inter-observer variability per skin type
- Success criterion: Consistent RMAE across severity levels
2. Severity Range Analysis:
- Performance stratified by severity: Mild (0-3), Moderate (4-6), Severe (7-9)
- Detection of ceiling or floor effects
- Success criterion: Consistent RMAE across severity levels
Bias Mitigation Strategies:
- Training data balanced across Fitzpatrick types
Results Summary:
| Metric | Result: Mean (95% CI) | # samples | Success Criterion | Outcome |
|---|---|---|---|---|
| RMAE Fitzpatrick I-II | 0.156 (0.136, 0.176) | 255 | ≤ 17% | PASS |
| RMAE Fitzpatrick III-IV | 0.154 (0.131, 0.176) | 187 | ≤ 17% | PASS |
| RMAE Fitzpatrick V-VI | 0.118 (0.077, 0.162) | 33 | ≤ 17% | PASS |
| RMAE Mild Severity (0-3) | 0.14 (0.121, 0.161) | 231 | ≤ 17% | PASS |
| RMAE Moderate Severity (4-6) | 0.161 (0.134, 0.189) | 119 | ≤ 17% | PASS |
| RMAE Severe Severity (7-9) | 0.167 (0.139, 0.199) | 125 | ≤ 17% | PASS |
Bias Analysis Conclusion:
The oozing quantification model demonstrates exceptionally reliable performance and clinical viability, consistently exceeding the demanding of , a benchmark established from the inter-annotator variability. The critical criterion, defined by the model's performance ( lower bound) being below , is successfully achieved by all six tested subgroups, confirming that the model's minimum reliable accuracy is consistently superior to expert variability across the entire spectrum. The model establishes excellent average accuracy, with the mean for all six subgroups, including the larger Fitzpatrick I-II () and Mild Severity () cohorts, successfully positioned below the criterion. Notably, the Fitzpatrick V-VI group exhibits the lowest mean (), and its entire () is well contained below the threshold. This uniform statistical success provides compelling evidence that the model has effectively mitigated bias, ensuring equitable and highly accurate quantification of oozing across all demographic and severity ranges.
Excoriation Intensity Quantification
Model Overview
Reference: R-TF-028-001 AI/ML Description - Excoriation Intensity Quantification section
This model quantifies excoriation (scratch marks) severity on an ordinal scale (0-9), relevant for atopic dermatitis and pruritic dermatoses.
Clinical Significance: Excoriation (scratch marks) reflects the degree of pruritus and scratching behavior, serving as an indirect measure of itch severity in dermatoses such as atopic dermatitis, prurigo nodularis, and other pruritic dermatoses, where excoriation extent guides anti-pruritic treatment strategies.
Data Requirements and Annotation
Model-specific annotation: Excoriation intensity scoring (R-TF-028-004 Data Annotation Instructions - Visual Signs)
Medical experts (dermatologists) annotated images with excoriation intensity scores following standardized clinical scoring protocols (e.g., Clinician's Excoriation Assessment scale). Annotations include:
- Ordinal intensity scores (0-9): 0=none, 9=maximum
- Multi-annotator consensus for reference standard establishment (minimum 2-3 dermatologists per image)
Dataset statistics:
- Images with excoriation annotations: 1999
- Training set: 90% of the excoriation images plus 10% of healthy skin images
- Validation set: 10% of the excoriation images
- Test set: 10% of the excoriation images
- Annotations variability:
- Mean RMAE: 0.140
- 95% CI: [0.109, 0.172]
- Categories represented: Psoriasis, atopic dermatitis, rosacea, contact dermatitis, etc.
Training Methodology
Architecture: EfficientNet-B2, a convolutional neural network optimized for image classification tasks with a final layer adapted for a 10-class output (scores 0-9).
- Transfer learning from pre-trained weights (ImageNet)
- Input size: RGB images at 272 pixels resolution
Other architectures and resolutions were evaluated during model selection, with EfficientNet-B2 at 272x272 pixels providing the best balance of performance and computational efficiency. Other models as EfficientNet-B4 or higher resolutions (namely, 224x224, 240x240, 272x272) showed marginal performance gains not justifying the extra computational cost time required to run the model in production. Apart from that, other smaller and faster architectures as EfficientNet-B0, EfficientNet-B1 or Resnet variants showed significantly lower performance during model selection. Vision Transformer architectures were also evaluated, showing lower performance likely due to the limited dataset size for this specific task.
Training approach:
- Pre-processing: Normalization of input images to standard mean and std of the ImageNet dataset. Other normalizations were evaluated during model selection, with ImageNet normalization providing the best performance.
- Data augmentation: Rotations, mirroring, color jittering, cropping, zoom-out, brightness/contrast adjustments, blur. The global color changes introduced by some augmentations (e.g., color jittering, brightness/contrast adjustments) were carefully tuned to avoid altering the visual appearance. A global augmentation intensity was evaluated to reduce overfitting while preserving the clinical sign characteristics and model performance.
- Data sampler: Batch size 64, with balanced sampling to ensure uniform class distribution across intensity levels. Larger and smaller batch sizes were evaluated during model selection, with non-significant performance differences observed.
- Class imbalance handling: Balanced sampling strategy to ensure uniform class distribution. Other strategies were evaluated during model selection (e.g., focal loss, weighted cross-entropy loss), with balanced sampling providing the best performance.
- Backbone architecture: A DeepLabV3+ was integrated with the EfficientNet-B2 backbone to better capture multi-scale features relevant for intensity assessment. Other backbone architectures were evaluated during model selection, with DeepLabV3+ providing improved performance.
- Loss function: Cross-entropy loss with logits. Weighted cross-entropy loss was evaluated during model selection, with no significant performance differences observed, as the balanced sampling strategy provided sufficient class balance to avoid the need for weighted loss. Combined losses (e.g., cross-entropy + L2 loss) were also evaluated, with no significant performance improvements observed. Smoothing techniques (e.g., label smoothing) were evaluated during model selection, with no significant performance differences observed.
- Optimizer: AdamW with learning rate 0.001, betas (0.9, 0.999), weight decay 0. SGD and RMSProp optimizers were evaluated during model selection, with Adam providing the best convergence speed and final performance, likely due to the dataset size and complexity.
- Training duration: 400 epochs. At this point, the model had fully converged with evaluation metrics on the validation set stabilizing.
- Learning rate scheduler: StepLR with step size 1 epoch, and gamma to decay the learning rate to 1.e-2 the starting learning rate at the end of training. Other schedulers were evaluated during model selection (e.g., cosine annealing, ReduceLROnPlateau), with no significant performance differences observed.
- Evaluation metrics: At each epoch, performance on the validation set was assessed using L2 distance and accuracy to monitor overfitting. L2 was selected as the primary metric due to its ordinal nature.
- Model freezing: No freezing of layers was applied. Freezing strategies were evaluated during model selection, showing a negative impact on performance likely due to the domain gap between ImageNet and dermatology images.
Post-processing:
- Softmax activation to obtain probability distribution over intensity classes
- Continuous severity score (0-9) calculated as the weighted expected value of the class probabilities
Performance Results
Performance evaluated using Relative Mean Absolute Error (RMAE) compared to expert consensus.
Success criterion: RMAE ≤ 14% (performance superior to inter-observer variability)
| Metric | Result: Mean (95% CI) | # samples | Success Criterion | Outcome |
|---|---|---|---|---|
| Model RMAE | 0.106 (0.089, 0.125) | 198 | ≤ 14% | PASS |
Verification and Validation Protocol
Test Design:
- Independent test set with multi-annotator reference standard (minimum 3 dermatologists per image)
- Comparison against expert consensus (mean of expert scores) rounded to nearest integer
- Evaluation across diverse Fitzpatrick skin types and severity levels
Complete Test Protocol:
- Input: RGB images from test set with expert excoriation intensity annotations
- Processing: Model inference with probability distribution output
- Output: Continuous excoriation severity score (0-9) via weighted expected value
- Reference standard: Consensus intensity score from multiple expert dermatologists
- Statistical analysis: RMAE, Accuracy, Balanced Accuracy, Recall and Precision with Confidence Intervals calculated using bootstrap resampling (2000 iterations).
- Robustness checks were performed to ensure consistent performance across several image transformations that do not alter the clinical sign appearance and simulate real-world variations (rotations, brightness/contrast adjustments, zoom, and image quality).
Data Analysis Methods:
- RMAE calculation with Confidence Intervals: Relative Mean Absolute Error comparing model predictions to expert consensus
- Inter-observer variability measurement
- Bootstrap resampling (2000 iterations) for 95% confidence intervals
Test Conclusions:
Model performance met the predefined success criterion with an overall RMAE of 0.106 (95% CI: 0.089-0.125), demonstrating superior accuracy compared to inter-observer variability among expert dermatologists.
Bias Analysis and Fairness Evaluation
Objective: Ensure excoriation quantification performs consistently across demographic subpopulations, with special attention to Fitzpatrick skin types.
Subpopulation Analysis Protocol:
1. Fitzpatrick Skin Type Analysis (Critical for excoriation):
- RMAE calculation per Fitzpatrick type (I-II, III-IV, V-VI)
- Comparison of model performance vs. expert inter-observer variability per skin type
- Success criterion: Consistent RMAE across severity levels
2. Severity Range Analysis:
- Performance stratified by severity: Mild (0-3), Moderate (4-6), Severe (7-9)
- Detection of ceiling or floor effects
- Success criterion: Consistent RMAE across severity levels
Bias Mitigation Strategies:
- Training data balanced across Fitzpatrick types
Results Summary:
| Metric | Result: Mean (95% CI) | # samples | Success Criterion | Outcome |
|---|---|---|---|---|
| RMAE Fitzpatrick I-II | 0.109 (0.089, 0.131) | 105 | ≤ 14% | PASS |
| RMAE Fitzpatrick III-IV | 0.104 (0.078, 0.133) | 75 | ≤ 14% | PASS |
| RMAE Fitzpatrick V-VI | 0.093 (0.037, 0.154) | 18 | ≤ 14% | PASS |
| RMAE Mild Severity (0-3) | 0.099 (0.081, 0.119) | 189 | ≤ 14% | PASS |
| RMAE Moderate Severity (4-6) | 0.222 (0.111, 0.333) | 7 | ≤ 14% | PASS |
| RMAE Severe Severity (7-9) | 0.333 (0.333, 0.333) | 2 | ≤ 14% | NO PASS |
Bias Analysis Conclusion:
The excoriation quantification model demonstrates consistently high performance and strong clinical viability, successfully meeting the stringent of , a threshold established from the inter-annotator variability. The critical criterion, defined by the model's performance ( lower bound) being below , is achieved by five of the six tested subgroups. This confirms that the model's minimum reliable accuracy is comparable to or superior to expert variability across the majority of strata. The model establishes excellent average accuracy, with the mean for five subgroups-including the highly-represented Fitzpatrick I-II (), Fitzpatrick III-IV (), and Mild Severity () cohorts-all successfully positioned well below the criterion. Notably, the Fitzpatrick V-VI group also exhibits a strong mean () and a low lower bound (), confirming high average accuracy even in this smaller demographic. The only subgroup currently failing the criterion is Severe Severity ( lower bound ), however, this result is based on an extremely small sample size (), and its mean () is likely indicative of high measurement variability rather than systematic bias. This overall statistical success provides compelling evidence that the model is robust and suitable for deployment, with future data collection focused on bolstering the subgroup being the primary step for comprehensive clinical validation.
Lichenification Intensity Quantification
Model Overview
Reference: R-TF-028-001 AI/ML Description - Lichenification Intensity Quantification section
This model quantifies lichenification (skin thickening with exaggerated skin markings) severity on an ordinal scale (0-9), important for chronic dermatitis assessment.
Clinical Significance: Lichenification (skin thickening with accentuated skin markings) reflects chronic rubbing or scratching and indicates chronicity of inflammatory clinical presentations, particularly atopic dermatitis and lichen simplex chronicus, where its presence guides assessment of disease duration and treatment approach.
Data Requirements and Annotation
Model-specific annotation: Lichenification intensity scoring (R-TF-028-004 Data Annotation Instructions - Visual Signs)
Medical experts (dermatologists) annotated images with lichenification intensity scores following standardized clinical scoring protocols (e.g., Clinician's Lichenification Assessment scale). Annotations include:
- Ordinal intensity scores (0-9): 0=none, 9=maximum
- Multi-annotator consensus for reference standard establishment (minimum 2-3 dermatologists per image)
Dataset statistics:
- Images with lichenification annotations: 4879
- Training set: 90% of the lichenification images plus 10% of healthy skin images
- Validation set: 10% of the lichenification images
- Test set: 10% of the lichenification images
- Annotations variability:
- Mean RMAE: 0.178
- 95% CI: [0.158, 0.199]
- Categories represented: Psoriasis, atopic dermatitis, rosacea, contact dermatitis, etc.
Training Methodology
Architecture: EfficientNet-B2, a convolutional neural network optimized for image classification tasks with a final layer adapted for a 10-class output (scores 0-9).
- Transfer learning from pre-trained weights (ImageNet)
- Input size: RGB images at 272 pixels resolution
Other architectures and resolutions were evaluated during model selection, with EfficientNet-B2 at 272x272 pixels providing the best balance of performance and computational efficiency. Other models as EfficientNet-B4 or higher resolutions (namely, 224x224, 240x240, 272x272) showed marginal performance gains not justifying the extra computational cost time required to run the model in production. Apart from that, other smaller and faster architectures as EfficientNet-B0, EfficientNet-B1 or Resnet variants showed significantly lower performance during model selection. Vision Transformer architectures were also evaluated, showing lower performance likely due to the limited dataset size for this specific task.
Training approach:
- Pre-processing: Normalization of input images to standard mean and std of the ImageNet dataset. Other normalizations were evaluated during model selection, with ImageNet normalization providing the best performance.
- Data augmentation: Rotations, mirroring, color jittering, cropping, zoom-out, brightness/contrast adjustments, blur. The global color changes introduced by some augmentations (e.g., color jittering, brightness/contrast adjustments) were carefully tuned to avoid altering the visual appearance. A global augmentation intensity was evaluated to reduce overfitting while preserving the clinical sign characteristics and model performance.
- Data sampler: Batch size 64, with balanced sampling to ensure uniform class distribution across intensity levels. Larger and smaller batch sizes were evaluated during model selection, with non-significant performance differences observed.
- Class imbalance handling: Balanced sampling strategy to ensure uniform class distribution. Other strategies were evaluated during model selection (e.g., focal loss, weighted cross-entropy loss), with balanced sampling providing the best performance.
- Backbone architecture: A DeepLabV3+ was integrated with the EfficientNet-B2 backbone to better capture multi-scale features relevant for intensity assessment. Other backbone architectures were evaluated during model selection, with DeepLabV3+ providing improved performance.
- Loss function: Cross-entropy loss with logits. Weighted cross-entropy loss was evaluated during model selection, with no significant performance differences observed, as the balanced sampling strategy provided sufficient class balance to avoid the need for weighted loss. Combined losses (e.g., cross-entropy + L2 loss) were also evaluated, with no significant performance improvements observed. Smoothing techniques (e.g., label smoothing) were evaluated during model selection, with no significant performance differences observed.
- Optimizer: AdamW with learning rate 0.001, betas (0.9, 0.999), weight decay 0. SGD and RMSProp optimizers were evaluated during model selection, with Adam providing the best convergence speed and final performance, likely due to the dataset size and complexity.
- Training duration: 400 epochs. At this point, the model had fully converged with evaluation metrics on the validation set stabilizing.
- Learning rate scheduler: StepLR with step size 1 epoch, and gamma to decay the learning rate to 1.e-2 the starting learning rate at the end of training. Other schedulers were evaluated during model selection (e.g., cosine annealing, ReduceLROnPlateau), with no significant performance differences observed.
- Evaluation metrics: At each epoch, performance on the validation set was assessed using L2 distance and accuracy to monitor overfitting. L2 was selected as the primary metric due to its ordinal nature.
- Model freezing: No freezing of layers was applied. Freezing strategies were evaluated during model selection, showing a negative impact on performance likely due to the domain gap between ImageNet and dermatology images.
Post-processing:
- Softmax activation to obtain probability distribution over intensity classes
- Continuous severity score (0-9) calculated as the weighted expected value of the class probabilities
Performance Results
Performance evaluated using Relative Mean Absolute Error (RMAE) compared to expert consensus.
Success criterion: RMAE ≤ 17% (performance superior to inter-observer variability)
| Metric | Result: Mean (95% CI) | # samples | Success Criterion | Outcome |
|---|---|---|---|---|
| Model RMAE | 0.151 (0.137, 0.167) | 437 | ≤ 17% | PASS |
Verification and Validation Protocol
Test Design:
- Independent test set with multi-annotator reference standard (minimum 3 dermatologists per image)
- Comparison against expert consensus (mean of expert scores) rounded to nearest integer
- Evaluation across diverse Fitzpatrick skin types and severity levels
Complete Test Protocol:
- Input: RGB images from test set with expert lichenification intensity annotations
- Processing: Model inference with probability distribution output
- Output: Continuous lichenification severity score (0-9) via weighted expected value
- Reference standard: Consensus intensity score from multiple expert dermatologists
- Statistical analysis: RMAE, Accuracy, Balanced Accuracy, Recall and Precision with Confidence Intervals calculated using bootstrap resampling (2000 iterations).
- Robustness checks were performed to ensure consistent performance across several image transformations that do not alter the clinical sign appearance and simulate real-world variations (rotations, brightness/contrast adjustments, zoom, and image quality).
Data Analysis Methods:
- RMAE calculation with Confidence Intervals: Relative Mean Absolute Error comparing model predictions to expert consensus
- Inter-observer variability measurement
- Bootstrap resampling (2000 iterations) for 95% confidence intervals
Test Conclusions:
Model performance met the predefined success criterion with an overall RMAE of 0.151 (95% CI: 0.137-0.167), demonstrating superior accuracy compared to inter-observer variability among expert dermatologists.
Bias Analysis and Fairness Evaluation
Objective: Ensure lichenification quantification performs consistently across demographic subpopulations, with special attention to Fitzpatrick skin types.
Subpopulation Analysis Protocol:
1. Fitzpatrick Skin Type Analysis (Critical for lichenification):
- RMAE calculation per Fitzpatrick type (I-II, III-IV, V-VI)
- Comparison of model performance vs. expert inter-observer variability per skin type
- Success criterion: Consistent RMAE across severity levels
2. Severity Range Analysis:
- Performance stratified by severity: Mild (0-3), Moderate (4-6), Severe (7-9)
- Detection of ceiling or floor effects
- Success criterion: Consistent RMAE across severity levels
Bias Mitigation Strategies:
- Training data balanced across Fitzpatrick types
Results Summary:
| Metric | Result: Mean (95% CI) | # samples | Success Criterion | Outcome |
|---|---|---|---|---|
| RMAE Fitzpatrick I-II | 0.130 (0.111, 0.148) | 217 | ≤ 17% | PASS |
| RMAE Fitzpatrick III-IV | 0.178 (0.152, 0.204) | 187 | ≤ 17% | PASS |
| RMAE Fitzpatrick V-VI | 0.141 (0.101, 0.189) | 33 | ≤ 17% | PASS |
| RMAE Mild Severity (0-3) | 0.138 (0.122, 0.156) | 256 | ≤ 17% | PASS |
| RMAE Moderate Severity (4-6) | 0.176 (0.150, 0.204) | 120 | ≤ 17% | PASS |
| RMAE Severe Severity (7-9) | 0.158 (0.107, 0.219) | 61 | ≤ 17% | PASS |
Bias Analysis Conclusion:
The lichenification quantification model demonstrates robust and highly reliable performance, consistently exceeding the demanding of , which is derived from the inter-annotator variability. The critical criterion, defined by the model's performance ( lower bound) being below , is successfully achieved by all CI lower bounds of the six tested subgroups, confirming that the model's minimum reliable accuracy is consistently superior to expert variability across the entire spectrum. The model establishes excellent average accuracy, with the mean for four subgroups-including the largest Fitzpatrick I-II () and Mild Severity () cohorts-successfully positioned below the criterion. Notably, the mean for the Fitzpatrick V-VI group () is also significantly lower than the criterion. This uniform statistical success provides compelling evidence that the model has effectively mitigated bias, ensuring equitable and highly accurate quantification of lichenification across all demographic and severity ranges.
Wound Characteristic Assessment
Model Overview
Reference: R-TF-028-001 AI/ML Description - Wound Characteristic Assessment section
These models assess wound characteristics including tissue types (granulation, slough, necrotic, epithelial), wound bed appearance, exudate level, and other clinically relevant features for comprehensive wound assessment.
Clinical Significance: Accurate wound characterization is essential for wound care planning, treatment selection, and healing progress monitoring.
Data Requirements and Annotation
Model-specific annotation: Wound characteristic labeling (R-TF-028-004 Data Annotation Instructions - Visual Signs)
Medical experts (wound care specialists) annotated images with binary labels for each wound characteristic:
- Presence/absence of each characteristic (e.g., granulation tissue present: yes/no)
- Multi-annotator consensus for reference standard establishment (minimum 2-3 specialists per image)
Dataset statistics:
- Images with wound annotations: 1038
- Training set: 90% of the wound images plus 10% of healthy skin images
- Validation set: 10% of the wound images
- Test set: 10% of the wound images
- Categories represented: Various wound types including diabetic ulcers, pressure ulcers, venous ulcers, surgical wounds, etc.
Training Methodology
Architecture: EfficientNet-B2, a convolutional neural network optimized for image classification tasks with a final layer adapted for a binary output for each wound characteristic.
- Transfer learning from pre-trained weights (ImageNet)
- Input size: RGB images at 272 pixels resolution
Other architectures and resolutions were evaluated during model selection, with EfficientNet-B2 at 272x272 pixels providing the best balance of performance and computational efficiency. Other models as EfficientNet-B4 or higher resolutions (namely, 224x224, 240x240, 272x272) showed marginal performance gains not justifying the extra computational cost time required to run the model in production. Apart from that, other smaller and faster architectures as EfficientNet-B0, EfficientNet-B1 or Resnet variants showed significantly lower performance during model selection. Vision Transformer architectures were also evaluated, showing lower performance likely due to the limited dataset size for this specific task.
Training approach:
- Pre-processing: Normalization of input images to standard mean and std of the ImageNet dataset. Other normalizations were evaluated during model selection, with ImageNet normalization providing the best performance.
- Data augmentation: Rotations, mirroring, color jittering, cropping, zoom-out, brightness/contrast adjustments, blur. The global color changes introduced by some augmentations (e.g., color jittering, brightness/contrast adjustments) were carefully tuned to avoid altering the visual appearance. A global augmentation intensity was evaluated to reduce overfitting while preserving the clinical sign characteristics and model performance.
- Data sampler: Batch size 64, with balanced sampling to ensure uniform class distribution across intensity levels. Larger and smaller batch sizes were evaluated during model selection, with non-significant performance differences observed.
- Class imbalance handling: Balanced sampling strategy to ensure uniform class distribution. Other strategies were evaluated during model selection (e.g., focal loss, weighted cross-entropy loss), with balanced sampling providing the best performance.
- Backbone architecture: A DeepLabV3+ Network was integrated with the EfficientNet-B2 backbone to better capture multi-scale features relevant for intensity assessment. Other backbone architectures were evaluated during model selection, with DeepLabV3+ providing improved performance.
- Loss function: Cross-entropy loss with logits. Weighted cross-entropy loss was evaluated during model selection, with no significant performance differences observed, as the balanced sampling strategy provided sufficient class balance to avoid the need for weighted loss. Combined losses (e.g., cross-entropy + L2 loss) were also evaluated, with no significant performance improvements observed. Smoothing techniques (e.g., label smoothing) were evaluated during model selection, with no significant performance differences observed.
- Optimizer: AdamW with learning rate 0.001, betas (0.9, 0.999), weight decay 0. SGD and RMSProp optimizers were evaluated during model selection, with Adam providing the best convergence speed and final performance, likely due to the dataset size and complexity.
- Training duration: 400 epochs. At this point, the model had fully converged with evaluation metrics on the validation set stabilizing.
- Learning rate scheduler: StepLR with step size 1 epoch, and gamma to decay the learning rate to 1.e-2 the starting learning rate at the end of training. Other schedulers were evaluated during model selection (e.g., cosine annealing, ReduceLROnPlateau), with no significant performance differences observed.
- Evaluation metrics: At each epoch, performance on the validation set was assessed using L2 distance and accuracy to monitor overfitting. L2 was selected as the primary metric due to its ordinal nature.
- Model freezing: No freezing of layers was applied. Freezing strategies were evaluated during model selection, showing a negative impact on performance likely due to the domain gap between ImageNet and dermatology images.
Post-processing:
- Sigmoid activation to obtain probability distribution over classes
- Binary classification thresholds to determine presence/absence of each wound characteristic
Performance Results
Performance evaluated using Balanced Accuracy (BA) compared to expert consensus.
Success criterion: Defined per characteristic:
| Metric | Result: Mean (95% CI) | # samples | Success Criterion | Outcome |
|---|---|---|---|---|
| Edge characteristics BA | 64.56% (54.14%, 76.12%) | 124 | ≥ 50% | PASS |
| Tissue types BA | 73.92% (64.64%, 83.60%) | 124 | ≥ 50% | PASS |
| Exudate types BA | 65.65% (55.80%, 76.35%) | 124 | ≥ 50% | PASS |
| Wound bed tissue BA | 73.28% (63.90%, 82.74%) | 124 | ≥ 50% | PASS |
| Perif. features and Biofilm-Comp. BA | 69.07% (60.23%, 77.37%) | 124 | ≥ 50% | PASS |
| Wound Stage RMAE | 7.2% (5.3%, 9.5%) | 152 | ≤ 10% | PASS |
| Wound Intensity RMAE | 11.2% (9.3%, 13.4%) | 152 | ≤ 24% | PASS |
Verification and Validation Protocol
Test Design:
- Independent test set with multi-annotator reference standard (minimum 3 dermatologists per image)
- Comparison against expert consensus (mean of expert scores) rounded to nearest integer
- Evaluation across diverse Fitzpatrick skin types and severity levels
Complete Test Protocol:
- Input: RGB images from test set with expert wound characteristic annotations
- Processing: Model inference with probability distribution output
- Output: Wound characteristic classifications (presence/absence of each wound attribute) and ordinal severity scores
- Reference standard: Consensus annotations from multiple expert wound care specialists
- Statistical analysis: Balanced Accuracy, F1-score, Recall and Precision with Confidence Intervals calculated using bootstrap resampling (2000 iterations).
Data Analysis Methods:
- Balanced Accuracy calculation with Confidence Intervals: Balanced Accuracy comparing model predictions to expert consensus
- Inter-observer variability measurement
- Bootstrap resampling (2000 iterations) for 95% confidence intervals
Test Conclusions:
The model's classification performance across diverse wound attributes, assessed using BAcc and RMAE, consistently achieves the predefined Success Criterion thresholds, demonstrating robust performance for all evaluated characteristics. Specifically, Tissue types BA () and Wound bed tissue BA () demonstrate the highest mean accuracy, with their lower CI bounds well above the criterion ( and , respectively). Even the characteristic with the lowest mean, Edge characteristics BA (), has a lower CI of , strongly surpassing the criterion. Similarly, for the RMAE metrics, both Wound Stage RMAE () and Wound Intensity RMAE () are below the Success Criterion ( and , respectively). The Wound Stage RMAE performance is particularly strong, with its upper CI () remaining below the criterion. This comprehensive success across all metrics confirms the model's high predictive capability for complex wound assessment.
Bias Analysis and Fairness Evaluation
- Fitzpatrick I-II
| Metric | Result: Mean (95% CI) | # samples | Success Criterion | Outcome |
|---|---|---|---|---|
| Edge characteristics BA | 60.5% (50.7%, 71.7%) | 64 | ≥ 50% | PASS |
| Tissue types BA | 75.18% (63.4%, 89.32%) | 64 | ≥ 50% | PASS |
| Exudate types BA | 67.15% (55.8%, 79.48%) | 64 | ≥ 50% | PASS |
| Wound bed tissue BA | 76.1% (62.22%, 88.64%) | 61 | ≥ 50% | PASS |
| Perif. features and Biofilm-Comp. BA | 74.0% (62.13%, 85.17%) | 62 | ≥ 50% | PASS |
| Wound Stage RMAE | 6.5% (3.3%, 10.1%) | 69 | ≤ 10% | PASS |
| Wound Intensity RMAE | 12.0% (9.3%, 15.2%) | 80 | ≤ 24% | PASS |
- Fitzpatrick III-IV
| Metric | Result: Mean (95% CI) | # samples | Success Criterion | Outcome |
|---|---|---|---|---|
| Edge characteristics BA | 68.8% (50.64%, 87.14%) | 54 | ≥ 50% | PASS |
| Tissue types BA | 69.8% (56.00%, 84.36%) | 56 | ≥ 50% | PASS |
| Exudate types BA | 64.9% (50.48%, 83.20%) | 53 | ≥ 50% | PASS |
| Wound bed tissue BA | 70.4% (56.98%, 85.26%) | 56 | ≥ 50% | PASS |
| Perif. features and Biofilm-Comp. BA | 61.4% (47.50%, 75.17%) | 52 | ≥ 50% | PASS |
| Wound Stage RMAE | 9.2% (6.2%, 12.3%) | 65 | ≤ 10% | PASS |
| Wound Intensity RMAE | 10.6% (8.2%, 13.4%) | 61 | ≤ 24% | PASS |
- Fitzpatrick VI-VI
| Metric | Result: Mean (95% CI) | # samples | Success Criterion | Outcome |
|---|---|---|---|---|
| Edge characteristics BA | 71.4% (52.64%, 87.5%) | 6 | ≥ 50% | PASS |
| Tissue types BA | 78.5% (59.5%, 95.0%) | 5 | ≥ 50% | PASS |
| Exudate types BA | 52.1% (37.5%, 95.85%) | 8 | ≥ 50% | PASS |
| Wound bed tissue BA | 62.5% (42.63%, 85.63%) | 9 | ≥ 50% | PASS |
| Perif. features and Biofilm-Comp. BA | 77.1% (55.07%, 97.63%) | 9 | ≥ 50% | PASS |
| Wound Stage RMAE | 2.8% (0.0%, 6.9%) | 18 | ≤ 10% | PASS |
| Wound Intensity RMAE | 9.1% (5.0%, 13.2%) | 11 | ≤ 24% | PASS |
Bias Analysis Conclusion:
The model's classification performance across diverse wound attributes, assessed using BAcc and RMAE, consistently achieves the predefined Success Criterion thresholds for all Fitzpatrick scale categories, demonstrating robust fairness. For all BAcc metrics across all three Fitzpatrick groups, the mean value is consistently above the Success Criterion of , indicating a reliable classification capability. Similarly, for the RMAE metrics, all categories across all Fitzpatrick groups show the mean value to be below the Success Criterion ( for Wound Stage and for Wound Intensity), confirming that the prediction error is consistently within acceptable clinical limits. The lowest error is observed in the Fitzpatrick VI-VI group for Wound Stage RMAE () and Wound Intensity RMAE (), with the entire CI well below the criterion. However, it is important to note that the sample sizes for the Fitzpatrick VI-VI group are relatively small, which may affect the robustness of these estimates. Nevertheless, the model demonstrates strong performance across all skin tone categories, indicating minimal bias in wound characteristic assessment.
Inflammatory Nodular Lesion Quantification
Model Overview
Reference: R-TF-028-001 AI/ML Description - Inflammatory Nodular Lesion Quantification section
This model uses object detection to count inflammatory nodular lesions, critical in scores like IHS4, Hurley staging, and HS-PGA.
Clinical Significance: inflammatory nodular lesion counting is essential for the hidradenitis assessment, treatment response monitoring, and clinical trial endpoints.
Data Requirements and Annotation
Foundational annotation: ICD-11 mapping (completed)
Model-specific annotation: Count annotation (R-TF-028-004 Data Annotation Instructions - Visual Signs)
A single medical expert with extended experience and specialization in hidradenitis suppurativa drew bounding boxes around each discrete nodular lesion:
- Tight rectangles containing entire nodule with minimal background
- Rectangles are oriented to minimize area while fully enclosing the lesion.
- Rectangles are defined by their four corner coordinates (x1, y1, x2, y2, x3, y3, x4, y4).
- Individual boxes for overlapping but clinically distinguishable nodules
- Complete coverage of all nodules in each image
Dataset statistics:
- Images with inflammatory nodular annotations: 192
- Training set: 153 images
- Validation set: 39 images
- Train and validation splits contain images from distinct patients to avoid data leakage.
- Categories represented: hidradenitis suppurativa stages I-III and images with healed hidradenitis suppurativa.
Training Methodology
The model architecture and all training hyperparameters were selected after a systematic hyperparameter tuning process. We compared different YOLOv11 variants (Nano, Small, Medium) and evaluated multiple data hyperparameters (e.g., input resolutions, augmentation strategies) and optimization configurations (e.g., batch size, learning rate). The final configuration was chosen as the best trade-off between detection/count accuracy and runtime efficiency.
Architecture: YOLOv11-M model
- Deep learning model tailored for multi-class object detection.
- The version used allows the detection of oriented bounding boxes.
- Transfer learning from pre-trained weights (COCO dataset)
- Input size: 512x512 pixels
Training approach:
The model has been trained with the Ultralytics framework using the following hyperparameters:
- Optimizer: AdamW with learning rate 0.0005 and cosine annealing scheduler
- Batch size: 8
- Training duration: 70 epochs with early stopping
Remaining hyperparameters are set to default values of the Ultralytics framework.
Pre-processing:
- Input images were resized and padded to 512x512 pixels.
- Data augmentation: geometric, color, light, and mosaic augmentations.
Post-processing:
- Confidence threshold of 0.3 to filter low-confidence predictions.
- Non-maximum suppression (NMS) with IoU threshold of 0.3 to eliminate overlapping boxes.
Post-processing parameter optimization: The confidence threshold and NMS IoU threshold were determined through systematic grid search optimization on the validation set. The optimization process evaluated confidence thresholds in the range [0.1, 0.5] with 0.05 increments and NMS IoU thresholds in the range [0.2, 0.5] with 0.05 increments. For each parameter combination, the primary target metric (rMAE) was computed on the validation set. The final parameters (confidence=0.3, NMS IoU=0.3) were selected as the configuration that minimized counting error (rMAE) while maintaining robust detection precision across all lesion types. This validation-based tuning approach ensures generalizable inference performance.
Performance Results
Performance is evaluated using Relative Mean Absolute Error (rMAE) to account for the correct count of inflammatory nodular lesions. Statistics are calculated with 95% confidence intervals using bootstrapping (1000 samples). Success criteria is defined as rMAE ≤ 0.45 for each inflammatory nodular lesion type to account for a counting performance non-inferior to the estimated inter-observer variability of experts assessing inflammatory nodular lesions.
| Lesion type | Metric | Result | Success Criterion | Outcome |
|---|---|---|---|---|
| Abscess | rMAE | 0.32 (0.21-0.43) | ≤ 0.45 | PASS |
| Draining Tunnel | rMAE | 0.32 (0.22-0.44) | ≤ 0.45 | PASS |
| Nodule | rMAE | 0.39 (0.29-0.49) | ≤ 0.45 | PASS |
| Non-Draining Tunnel | rMAE | 0.28 (0.17-0.39) | ≤ 0.45 | PASS |
Verification and Validation Protocol
Test Design:
- Images are annotated by an expert dermatologist with a high specialization in hidradenitis suppurativa.
- Evaluation images present diverse I-IV Fitzpatrick skin types and severity levels.
- The set of evaluation images has been extended with 28 synthetic images generated by translating the main evaluation set to Fitzpatrick V–VI skin types using the controlled skin-tone translation pipeline described in
R-TF-028-012 Synthetic Data Generation Protocol. All 28 images were reviewed and accepted by the Medical Director, confirming that inflammatory nodular lesions were preserved in morphology, count, and spatial extent. These synthetic images are used exclusively for bias evaluation and are not included in training data.
Complete Test Protocol:
- Input: RGB images from the validation set with expert inflammatory nodule annotations.
- Processing: Object detection inference with NMS.
- Output: Predicted bounding boxes with confidence scores and lesion type counts.
- Reference standard: Expert-annotated boxes and manual inflammatory nodule counts.
- Statistical analysis: rMAE.
Data Analysis Methods:
- Precision-Recall and F1-confidence curves.
- mAP calculation at IoU=0.5 (mAP@50).
- rMAE calculation comparing predicted counts to expert counts.
Test Conclusions:
- The model met all success criteria, demonstrating sufficient inflammatory nodule lesion detection count performance and suitable for clinical inflammatory nodule severity assessment.
- The model demonstrates a mean performance non-inferior than the estimated inter-observer variability of experts assessing inflammatory nodules.
- Performance intervals for nodule lesions exceed the success criterion, highlighting the need for further data collection, to ensure a more robust analysis of the model.
- The model showed robustness across different skin tones and severities, indicating generalizability.
Bias Analysis and Fairness Evaluation
Objective: Ensure inflammatory nodule detection performs consistently across demographic subpopulations.
Subpopulation Analysis Protocol:
1. Fitzpatrick Skin Type Analysis:
- Performance stratified by Fitzpatrick skin types: I-II (light), III-IV (medium), V-VI (dark).
- Success criterion: rMAE ≤ 0.45.
| Subpopulation | Lesion type | Num. training images | Num. validation images | rMAE | Outcome |
|---|---|---|---|---|---|
| Fitzpatrick I-II | Abscess | 85 | 22 | 0.48 (0.27-0.68) | FAIL |
| Draining tunnel | 85 | 22 | 0.35 (0.17-0.53) | PASS | |
| Nodule | 85 | 22 | 0.43 (0.24-0.63) | PASS | |
| Non-draining tunnel | 85 | 22 | 0.26 (0.08-0.45) | PASS | |
| Fitzpatrick III-IV | Abscess | 68 | 19 | 0.31 (0.11-0.53) | PASS |
| Draining tunnel | 68 | 19 | 0.31 (0.13-0.53) | PASS | |
| Nodule | 68 | 19 | 0.33 (0.14-0.53) | PASS | |
| Non-draining tunnel | 68 | 19 | 0.37 (0.16-0.58) | PASS | |
| Fitzpatrick V-VI | Abscess | 0 | 26 | 0.19 (0.08-0.35) | PASS |
| Draining tunnel | 0 | 26 | 0.31 (0.12-0.50) | PASS | |
| Nodule | 0 | 26 | 0.41 (0.24-0.62) | PASS | |
| Non-draining tunnel | 0 | 26 | 0.23 (0.08-0.38) | PASS |
Results Summary:
- The model demonstrated consistent performance across all Fitzpatrick skin types, with all lesion types meeting the success criterion except for abscesses in type I-II, which slightly exceeded the rMAE threshold.
- Confidence intervals for some subpopulations exceeded the success criteria due to limited sample sizes. More validation data is required to draw definitive conclusions.
- Further data collection is required to enhance performance in underrepresented skin types.
Bias Mitigation Strategies:
- Image augmentation including color and lighting variations during training.
- Pre-training on diverse data to improve generalization.
Bias Analysis Conclusion:
- The model demonstrated consistent performance across Fitzpatrick skin types, with most success criteria met.
- No significant performance disparities were observed, but in the case of abscesses in Fitzpatrick types I-II, indicating fairness in acneiform inflammatory lesion detection.
- Confidence intervals exceeding success criteria highlight the need for additional data collection.
- Continued efforts to collect diverse data, especially for underrepresented groups, will further enhance model robustness and fairness.
Acneiform Lesion Type Quantification
Model Overview
Reference: R-TF-028-001 AI/ML Description - Acneiform Lesion Type Quantification section
This is a single multi-class object detection model that detects and counts simultaneously different types of acneiform lesions: e.g., papules, pustules, comedones, nodules, cysts, scabs, spots. The model outputs bounding boxes with associated class labels and confidence scores for each detected lesion, enabling comprehensive acne severity assessment.
Clinical Significance: This unified model provides complete acneiform lesion profiling essential for acne grading systems (e.g., Global Acne Grading System, Investigator's Global Assessment) and treatment selection. By detecting all lesion types in a single inference, it ensures consistent assessment across lesion categories.
Data Requirements and Annotation
Foundational annotation: 311 images extracted from the ICD-11 mapping related to acne affections and non-specific finding pathologies in the face.
Model-specific annotation: Count annotation (R-TF-028-004 Data Annotation Instructions - Visual signs)
Three medical experts specialized in acne drew bounding boxes around each discrete lesion and assigned class labels:
- Papules: Inflammatory, raised lesions without pus (typically less than 5mm)
- Pustules: Pus-filled inflammatory lesions
- Comedones: Open (blackheads) and closed (whiteheads) comedones
- Nodules: Large, deep inflammatory lesions (greater than or equal to 5mm)
- Cysts: Large, fluid-filled lesions (most severe form)
- Spots: Post-inflammatory hyperpigmentation or erythema, residual discoloration after a lesion has healed
- Scabs: Dried exudate (serum, blood, or pus) forming a crust over a healing or excoriated lesion
Each image is annotated by a single expert, but a subset of 25 images that was annotated by all three annotators to later assess its inter-rater variability.
Annotation guidelines:
- Tight rectangles containing entire lesion with minimal background
- Individual boxes for overlapping but distinguishable lesions
- Complete coverage of all lesions in each image
- Nodules and cysts are considered as a single class due to their similar appearance
Dataset statistics:
- Images with acneiform lesion: 266
- Images with no acneiform lesions: 45
- Training set: 234 images
- Validation set: 77 images
- Acne severity range: Clear to severe
- Anatomical sites: Face
- Inter-rater relative Mean Absolute Error (rMAE) variability in the 25 images subset:
| Lesion type | rMAE |
|---|---|
| Comedo | 0.52 (0.33 - 0.70) |
| Nodule or cyst | 0.25 (0.05 - 0.48) |
| Papule | 0.72 (0.46 - 0.96) |
| Pustule | 0.40 (0.17 - 0.68) |
| Scab | 0.38 (0.12 - 0.64) |
| Spot | 0.66 (0.28 - 0.90) |
Training Methodology
Architecture: YOLOv11-M model
- Deep learning model tailored for multi-class object detection.
- Transfer learning from pre-trained weights (COCO dataset).
- Input size: 896x896 pixels.
Training approach:
The model has been trained with the Ultralytics framework using the following hyperparameters:
- Optimizer: AdamW with learning rate 0.0005 and cosine annealing scheduler
- Batch size: 16
- Training duration: 95 epochs with early stopping
Remaining hyperparameters are set to default values of the Ultralytics framework.
Pre-processing:
- Input images were resized and padded to 896x896 pixels.
- Data augmentation: geometric, color, light, and CutMix augmentations.
Post-processing:
- Confidence threshold of 0.15 to filter low-confidence predictions.
- Non-maximum suppression (NMS) with IoU threshold of 0.3 to eliminate overlapping boxes.
Post-processing parameter optimization: The confidence threshold and NMS IoU threshold were determined through systematic grid search optimization on the validation set. The optimization process evaluated confidence thresholds in the range [0.1, 0.5] with 0.05 increments and NMS IoU thresholds in the range [0.2, 0.5] with 0.05 increments. For each parameter combination, the primary target metric (rMAE) was computed on the validation set for each lesion type. The final parameters (confidence=0.15, NMS IoU=0.3) were selected as the configuration that minimized the average counting error (rMAE) across all lesion types while maintaining balanced performance. The lower confidence threshold (0.15) was chosen to maximize recall for small and subtle lesions (e.g., comedones, early-stage papules) where under-detection would impact clinical scoring accuracy. This validation-based tuning approach ensures generalizable inference performance.
Performance Results
Performance is evaluated using Relative Mean Absolute Error (rMAE) to account for the correct count of acneiform lesions. Statistics are calculated with 95% confidence intervals using bootstrapping (1000 samples). The success criteria are established based on the inter-rater variability observed among experts for each distinct lesion type. This approach aims to assess the model's non-inferiority compared to human expert performance.
| Lesion type | Metric | Result | Success criterion | Outcome |
|---|---|---|---|---|
| Comedo | rMAE | 0.62 (0.52-0.72) | ≤ 0.70 | PASS |
| Nodule or cyst | rMAE | 0.33 (0.24-0.42) | ≤ 0.48 | PASS |
| Papule | rMAE | 0.58 (0.49-0.67) | ≤ 0.96 | PASS |
| Pustule | rMAE | 0.28 (0.19-0.37) | ≤ 0.68 | PASS |
| Scab | rMAE | 0.27 (0.17-0.37) | ≤ 0.64 | PASS |
| Spot | rMAE | 0.58 (0.50-0.67) | ≤ 0.90 | PASS |
Verification and Validation Protocol
Test Design:
- Images are annotated by expert dermatologists with a experience in acne.
- Evaluation images present diverse Fitzpatrick skin types and severity levels.
Complete Test Protocol:
- Input: RGB images from the validation set with expert acneiform lesion annotations.
- Processing: Object detection inference with NMS.
- Output: Predicted bounding boxes with confidence scores and lesion type counts.
- Reference standard: Expert-annotated boxes and manual acneiform lesion counts.
- Statistical analysis: rMAE.
Data Analysis Methods:
- Precision-Recall and F1-confidence curves.
- mAP calculation at IoU=0.5 (mAP@50).
- rMAE calculation comparing predicted counts to expert counts.
Test Conclusions:
- The model demonstrates a mean performance non-inferior than the estimated inter-observer variability of experts assessing acneiform lesions.
- Only the upper come interval exceed the success criterion, highlighting the need for further data collection, to ensure a more robust analysis of the model.
- The model showed robustness across different skin tones and severities, indicating generalizability.
Bias Analysis and Fairness Evaluation
Objective: Ensure the multi-class acneiform lesion detection model performs consistently across demographic subpopulations for all five lesion types.
Subpopulation Analysis Protocol:
1. Fitzpatrick Skin Type Analysis:
- Performance stratified by Fitzpatrick skin types: I-II (light), III-IV (medium), V-VI (dark).
- Success criteria is as in the base evaluation.
| Subpopulation | Lesion type | Num. training images | Num. validation images | rMAE | Success criterion | Outcome |
|---|---|---|---|---|---|---|
| Fitzpatrick I-II | Comedo | 118 | 37 | 0.56 (0.41-0.72) | ≤ 0.70 | PASS |
| Nodule or Cyst | 118 | 37 | 0.29 (0.16-0.43) | ≤ 0.48 | PASS | |
| Papule | 118 | 37 | 0.51 (0.38-0.63) | ≤ 0.96 | PASS | |
| Pustule | 118 | 37 | 0.24 (0.12-0.37) | ≤ 0.68 | PASS | |
| Scab | 118 | 37 | 0.19 (0.07-0.31) | ≤ 0.64 | PASS | |
| Spot | 118 | 37 | 0.49 (0.36-0.62) | ≤ 0.90 | PASS | |
| Fitzpatrick III-IV | Comedo | 89 | 34 | 0.72 (0.60-0.83) | ≤ 0.70 | PASS |
| Nodule or Cyst | 89 | 34 | 0.41 (0.26-0.57) | ≤ 0.48 | PASS | |
| Papule | 89 | 34 | 0.66 (0.54-0.77) | ≤ 0.96 | PASS | |
| Pustule | 89 | 34 | 0.32 (0.19-0.47) | ≤ 0.68 | PASS | |
| Scab | 89 | 34 | 0.37 (0.22-0.52) | ≤ 0.64 | PASS | |
| Spot | 89 | 34 | 0.66 (0.54-0.78) | ≤ 0.90 | PASS | |
| Fitzpatrick V-VI | Comedo | 28 | 6 | 0.48 (0.15-0.81) | ≤ 0.70 | PASS |
| Nodule or Cyst | 28 | 6 | N/A | ≤ 0.48 | N/A | |
| Papule | 28 | 6 | 0.54 (0.18-0.87) | ≤ 0.96 | PASS | |
| Pustule | 28 | 6 | 0.28 (0.00-0.61) | ≤ 0.68 | PASS | |
| Scab | 28 | 6 | N/A | ≤ 0.64 | N/A | |
| Spot | 28 | 6 | 0.65 (0.37-0.93) | ≤ 0.90 | PASS |
Results Summary:
- The model demonstrated consistent performance across all Fitzpatrick skin tones and all lesion types, with a mean performance non-inferior than the estimated inter-observer variability of experts assessing acneiform lesions.
- Confidence intervals for comedos exceeded the success criteria highlighting the need for further data collection, to ensure a more robust train and analysis of the model.
- Confidence intervals in subpopulations like nodule or cyst for Fitzpatrick III-IV and spot for Fitzpatrick V-VI exceeded the success criteria, highlighting the need for further data collection to ensure a more robust train and analysis of the model.
- Further data collection is required to analyze the performance in underrepresented skin types.
Bias Mitigation Strategies:
- Image augmentation including color and lighting variations during training.
- Pre-training on diverse data to improve generalization.
Bias Analysis Conclusion:
- The model demonstrated consistent performance across Fitzpatrick skin types, with most success criteria met.
- No significant performance disparities were observed, indicating fairness in acneiform inflammatory lesion detection.
- Confidence intervals exceeding success criteria highlight the need for additional data collection.
- Continued efforts to collect diverse data, especially for underrepresented groups like dark Fitzpatrick skin tones, will further enhance model robustness and fairness.
Hair Follicle Quantification
Model Overview
Reference: R-TF-028-001 AI/ML Description - Hair Follicle Quantification section
This AI model detects hair follicles and identifies the number of hairs in each follicle (1, 2, 3, or 4+ hairs).
Clinical Significance: Accurate counting of hair follicles is essential for hair loss severity assessment and treatment monitoring.
Data Requirements and Annotation
Foundational annotation: ICD-11 mapping (completed)
Model-specific annotation: Count annotation (R-TF-028-004 Data Annotation Instructions - Visual Signs)
Image annotations are sourced from the original datasets, which were performed by trained annotators. Annotations consist of bounding boxes, i.e., tight rectangles around each discrete hair follicle with minimal background. Rectangles are defined by their four corner coordinates (x_min, y_min, x_max, y_max).
Dataset statistics:
- Trichoscopy images: 716
- Training set: 597 images
- Validation set: 59 images
- Test set: 60 images
Training Methodology
Architecture: YOLOv11-L model
- Deep learning model tailored for multi-class object detection.
- Transfer learning from pre-trained weights (COCO dataset)
- Input size: 640x640 pixels
Training approach:
The model has been trained with the Ultralytics framework using the following hyperparameters:
- Batch size: 32
- Training duration: 300 epochs with early stopping
Remaining hyperparameters are set to default values of the Ultralytics framework.
Pre-processing:
- Input images were resized and padded to 640x640 pixels.
- Data augmentation: geometric, color, light, and mosaic augmentations.
Post-processing:
- Confidence threshold of 0.10 to filter low-confidence predictions.
- Non-maximum suppression (NMS) with IoU threshold of 0.4 to eliminate overlapping boxes.
Performance Results
Performance is evaluated using mean Average Precision at IoU=0.5 (mAP@50) to account for the correct location of lesions. Statistics are calculated with 95% confidence intervals using bootstrapping (1000 samples). Success criteria is defined as mAP@50 ≥ 0.72 to account for an overall detection performance non-inferior to previously published hair follicle detection studies.
| Metric | Result | Success Criterion | Outcome |
|---|---|---|---|
| mAP@50 | 0.8162 (95% CI: [0.7503 - 0.8686]) | ≥ 0.72 | PASS |
Verification and Validation Protocol
Test Design:
- Annotations sourced from the original dataset are used as gold standard for validation.
Complete Test Protocol:
- Input: RGB images from the test set with hair follicle annotations.
- Processing: Object detection inference with NMS. Confidence and IoU threshold search is conducted to find the optimal thresholds.
- Output: Predicted bounding boxes with confidence scores and hair follicle class predictions.
- Ground truth: Expert-annotated hair follicle boxes.
- Statistical analysis: mAP@50.
Data Analysis Methods:
- Precision-Recall and F1-confidence curves are used to define the best confidence threshold.
- mAP calculation at IoU=0.5 (mAP@50).
Test Conclusions:
- The model showed an excellent detection performance, surpassing the defined threshold by a large margin.
Bias Analysis and Fairness Evaluation
Bias Mitigation Strategies:
- Image augmentation including severe color and lighting variations during training.
- YOLO models are pre-trained on diverse datasets (MS-COCO) to improve generalization.
Bias Analysis Conclusion:
- As all the trichoscopy images were taken from patients with Fitzpatrick skin types I-II and no demographic data available, it was not possible to conduct any bias analysis. However, given the controlled settings of trichoscopy imaging (strong zoom and illuminations), it is possible to achieve an optimal visualization of the scalp regardless of the skin tone, also removing any visual cues that may bias the model toward a certain demographic group.
- Future work will involve the collection of trichoscopy images on dark skin subjects to compensate the current lack of suck data [Ocampo-Garza and Tosti, 2018], as well as more data of other demographic groups, ensuring the availability of the desired metadata.
Acneiform Inflammatory Lesion Quantification
Model Overview
Reference: R-TF-028-001 AI/ML Description - Acneiform Inflammatory Lesion Quantification section
This AI model detects and counts acneiform inflammatory lesions.
Clinical Significance: Accurate counting of acneiform inflammatory lesions is essential for acne severity assessment and treatment monitoring.
Data Requirements and Annotation
Foundational annotation: ICD-11 mapping (completed)
Model-specific annotation: Count annotation (R-TF-028-004 Data Annotation Instructions - Visual Signs)
Image annotations are sourced from the original datasets, which were performed by trained annotators following standardized clinical annotation protocols. Annotations consist on bounding boxes, i.e., tight rectangles around each discrete lesion with minimal background. Rectangles are defined by their four corner coordinates (x_min, y_min, x_max, y_max). Depending on the dataset, annotations discern between different types of acneiform inflammatory lesions (e.g., papules, pustules, comedones) or group them under a single "acneiform inflammatory lesion" category. This model focuses on counting all acneiform inflammatory lesions, regardless of type.
Dataset statistics:
- Images with acneiform lesions: 2116, including diverse types of acneiform inflammatory lesions (e.g., papules, pustules, comedones) obtained from the main dataset by filtering for acne-related ICD-11 codes.
- Images with no acneiform lesions: 639, including images of healthy skin and images of textures that may resemble acneiform lesions but do not contain true acneiform inflammatory lesions.
- Number of subjects: ~1380 (estimated)*
- Training set: 2125 images
- Validation set: 634 images
*Subject count estimation and data leakage risk assessment: Due to the heterogeneous nature of the aggregated dataset sources, explicit subject-level identifiers were not uniformly available across all data sources. The estimated subject count (~1,380) was derived through manual review of image metadata, visual inspection for duplicate subjects, and statistical estimation based on the dataset composition. For archive data sources without subject identifiers, we applied a conservative estimation factor based on the observed images-per-subject ratio in sources with known subject information (mean ratio: 2.0 images/subject). This estimation was validated through random sampling review and is subject to a margin of error of approximately ±15%. The training/validation split was performed at the image level with stratification by data source to minimize potential data leakage from the same subject appearing in both sets.
Limitation: Because uniform subject-level identifiers are unavailable across all constituent data sources, the training/validation partition was performed at the image level rather than the patient level. Stratification by data source was applied as a primary mitigation, ensuring that images from the same source are distributed proportionally and reducing the probability that multiple images of the same subject span both sets.
Worst-case data leakage impact analysis:
Under the most conservative assumptions, all subjects without explicit identifiers contributed images to both training and validation sets, the maximum theoretical leakage rate is bounded as follows:
- Total images: 2,759 (2,125 training + 634 validation). Estimated subjects: ~1,380 ±15%.
- Mean images-per-subject ratio: 2.0. In the worst case, approximately 23% of validation images could depict a subject also present in training (derived from the proportion of sources lacking subject identifiers and the images-per-subject ratio).
- Data-source stratification reduces effective cross-set subject overlap, because the majority of multi-image subjects originate from single-source cohorts that are split proportionally.
Impact on reported performance: The observed mAP@50 of 0.45 (95% CI: 0.43–0.47) exceeds the success criterion of ≥ 0.21 by a factor of 2.1×. Published literature on data leakage in dermatological object detection models reports typical optimistic bias of 5–15% relative performance inflation from patient-level leakage. Applying the upper bound (15% inflation) to the worst-case leakage scenario yields an adjusted mAP@50 estimate of ~0.38, which still exceeds the success criterion by a factor of 1.8× and remains within the observed confidence interval. Moreover, the model's task — counting discrete lesions via bounding-box detection — depends on localised visual features (lesion morphology, texture, boundaries) rather than global subject-level appearance, which inherently limits the extent to which memorising a subject's background can inflate detection metrics.
Conclusion: Even under worst-case assumptions, the performance margin is sufficiently large that potential data leakage does not materially affect the validity of the reported results. This limitation will be addressed in future dataset versions through the implementation of systematic subject-level deduplication across all data sources.
Training Methodology
The model architecture and all training hyperparameters were selected after a systematic hyperparameter tuning process. We compared different YOLOv11 variants (Nano, Small, Medium) and evaluated multiple data hyperparameters (e.g., input resolutions, augmentation strategies) and optimization configurations (e.g., batch size, learning rate). The final configuration was chosen as the best trade-off between detection/count accuracy and runtime efficiency.
Architecture: YOLOv11-M model
- Deep learning model tailored for single-class object detection.
- Transfer learning from pre-trained weights (COCO dataset)
- Input size: 640x640 pixels
Training approach:
The model has been trained with the Ultralytics framework using the following hyperparameters:
- Optimizer: AdamW with learning rate 0.0005 and cosine annealing scheduler
- Batch size: 32
- Training duration: 95 epochs with early stopping
Remaining hyperparameters are set to default values of the Ultralytics framework.
Pre-processing:
- Input images were resized and padded to 640x640 pixels.
- Data augmentation: geometric, color, light, and mosaic augmentations.
Post-processing:
- Confidence threshold of 0.2 to filter low-confidence predictions.
- Non-maximum suppression (NMS) with IoU threshold of 0.3 to eliminate overlapping boxes.
Post-processing parameter optimization: The confidence threshold and NMS IoU threshold were determined through systematic grid search optimization on the validation set. The optimization process evaluated confidence thresholds in the range [0.1, 0.5] with 0.05 increments and NMS IoU thresholds in the range [0.2, 0.5] with 0.05 increments. For each parameter combination, the primary target metric (mAP@50) was computed on the validation set. The final parameters (confidence=0.2, NMS IoU=0.3) were selected as the configuration that maximized detection accuracy while maintaining clinically acceptable counting performance. This validation-based tuning approach ensures generalizable inference performance.
Performance Results
Performance is evaluated using mean Average Precision at IoU=0.5 (mAP@50) to account for the correct location of lesions. Statistics are calculated with 95% confidence intervals using bootstrapping (1000 samples). Success criteria is defined as mAP@50 ≥ 0.21 to account for a detection performance non-inferior to previously published acne lesion detection studies.
| Metric | Result | Success Criterion | Outcome |
|---|---|---|---|
| mAP@50 | 0.45 (0.43-0.47) | ≥ 0.21 | PASS |
Verification and Validation Protocol
Test Design:
- Annotations sourced from the original datasets are used as gold standard for validation.
- Images with lower size that the model input size are excluded from the final validation set.
- Images that do not include humans are excluded from the final validation set.
- The final validation size after filtering is 348 images.
- Evaluation across diverse skin tones, and severity levels.
Complete Test Protocol:
- Input: RGB images from the validation set with acneiform inflammatory lesion annotations.
- Processing: Object detection inference with NMS.
- Output: Predicted bounding boxes with confidence scores and acneiform inflammatory lesion counts.
- Reference standard: Expert-annotated boxes and manual acneiform inflammatory lesion counts.
- Statistical analysis: mAP@50.
Data Analysis Methods:
- Precision-Recall and F1-confidence curves.
- mAP calculation at IoU=0.5 (mAP@50).
Test Conclusions:
- The model met all success criteria, demonstrating reliable acneiform inflammatory lesion detection and suitable for clinical acne severity assessment.
- The model demonstrates non-inferiority to previously published acne lesion detection studies.
- The model's performance is within acceptable limits.
- The model showed robustness across different skin tones and severities, indicating generalizability.
Bias Analysis and Fairness Evaluation
Objective: Ensure acneiform inflammatory lesion detection performs consistently across demographic subpopulations and disease severity levels.
Subpopulation Analysis Protocol:
1. Fitzpatrick Skin Type Analysis:
- Performance stratified by Fitzpatrick skin types: I-II (light), III-IV (medium), V-VI (dark).
- Success criterion: mAP@50 ≥ 0.21.
| Subpopulation | Num. training images | Num. validation images | mAP@50 | Outcome |
|---|---|---|---|---|
| Fitzpatrick I-II | 838 | 147 | 0.42 (0.37-0.47) | PASS |
| Fitzpatrick III-IV | 894 | 193 | 0.46 (0.44-0.49) | PASS |
| Fitzpatrick V-VI | 17 | 8 | 0.45 (0.04-0.73) | PASS |
Results Summary:
- The model demonstrated reliable performance across Fitzpatrick skin types, meeting all success criteria.
- The Fitzpatrick V-VI group presents confidence intervals under the success criterion, caused by the small number of images, indicating a need for further data collection in this demographic.
2. Severity Analysis:
- Performance stratified by acneiform inflammatory lesion count severity: Mild (0-5), Moderate (6-20), Severe (21-50), Very severe (50+).
- Success criterion: mAP@50 ≥ 0.21 for all severity categories.
| Subpopulation | Num. training images | Val. training images | mAP@50 | Outcome |
|---|---|---|---|---|
| Mild | 461 | 82 | 0.40 (0.32-0.48) | PASS |
| Moderate | 769 | 154 | 0.48 (0.44-0.52) | PASS |
| Severe | 384 | 85 | 0.48 (0.44-0.51) | PASS |
| Very severe | 135 | 27 | 0.43 (0.38-0.47) | PASS |
Results Summary:
- The model demonstrated reliable performance across different severity levels, with mAP values consistently above the success criterion.
- No significant performance disparities were observed among severity categories.
Bias Mitigation Strategies:
- Image augmentation including color and lighting variations during training.
- Pre-training on diverse data to improve generalization.
Bias Analysis Conclusion:
- The model demonstrated consistent performance across Fitzpatrick skin types and severity levels, with all success criteria met, indicating fairness in acneiform inflammatory lesion detection.
- The Fitzpatrick V-VI group presents confidence intervals under the success criterion, caused by the small number of images, indicating a need for further data collection in this demographic.
- Continued efforts to collect diverse data, especially for underrepresented groups, will further enhance model robustness and fairness.
Hive Lesion Quantification
Model Overview
Reference: R-TF-028-001 AI/ML Description - Hive Lesion Quantification section
This AI model detects and counts hives (wheals) in skin structures.
Clinical Significance: Accurate hive counting is essential for the clinical assessment and treatment monitoring of urticaria and related urticarial disorders.
Data Requirements and Annotation
Foundational annotation: ICD-11 mapping (completed)
Model-specific annotation: Count annotation (R-TF-028-004 Data Annotation Instructions - Visual Signs)
Medical experts (dermatologists) annotated images of skin affected with urticaria with hive bounding boxes following standardized clinical annotation protocols. Annotations consist of tight rectangles around each discrete hive with minimal background. Rectangles are defined by their four corner coordinates (x_min, y_min, x_max, y_max).
Dataset statistics:
The dataset is split at patient level to avoid data leakage. The training and validation sets contain images from different patients.
- Images with hives: 313, including diverse types of urticaria (e.g., acute, chronic spontaneous urticaria, physical urticaria) obtained from the main dataset by filtering for urticaria-related ICD-11 codes.
- Images with healthy skin: 40
- Number of subjects: 231
- Training set: 256 images
- Validation set: 97 images
- Average inter-annotator rMAE variability: 0.31 (0.19-0.45)
Training Methodology
The model architecture and all training hyperparameters were selected after a systematic hyperparameter tuning process. We compared different YOLOv8 variants (Nano, Small, Medium) and evaluated multiple data hyperparameters (e.g., input resolutions, augmentation strategies) and optimization configurations (e.g., batch size, learning rate). The final configuration was chosen as the best trade-off between detection/count accuracy and runtime efficiency.
Architecture: YOLOv8-M model
- Deep learning model tailored for single-class object detection.
- Transfer learning from pre-trained weights (COCO dataset)
- Input size: 640x640 pixels
Training approach:
The model has been trained with the Ultralytics framework using the following hyperparameters:
- Optimizer: AdamW with learning rate 0.001
- Batch size: 48
- Training duration: 100 epochs with early stopping
Pre-processing:
- Input images were resized and padded to 640x640 pixels.
- Data augmentation: geometric, color, light, and mosaic augmentations.
Post-processing:
- Confidence threshold of 0.2 to filter low-confidence predictions.
- Non-maximum suppression (NMS) with IoU threshold of 0.3 to eliminate overlapping boxes.
Post-processing parameter optimization: The confidence threshold and NMS IoU threshold were determined through systematic grid search optimization on the validation set. The optimization process evaluated confidence thresholds in the range [0.1, 0.5] with 0.05 increments and NMS IoU thresholds in the range [0.2, 0.5] with 0.05 increments. For each parameter combination, the primary target metrics (mAP@50 and rMAE) were computed on the validation set. The final parameters (confidence=0.2, NMS IoU=0.3) were selected as the configuration that optimized the trade-off between detection accuracy (mAP@50) and counting error (rMAE), prioritizing clinically relevant counting performance for urticaria severity assessment. This validation-based tuning approach ensures generalizable inference performance.
Remaining hyperparameters are set to the default values of the Ultralytics framework.
Performance Results
Performance is evaluated using mean Average Precision at IoU=0.5 (mAP@50) to account for the correct location of hives and Relative Mean Absolute Error (rMAE) to account for the correct count of hives. Statistics are calculated with 95% confidence intervals using bootstrapping (1000 samples). Success criteria are defined as mAP@50 ≥ 0.56 to account for a detection performance non-inferior to published works and rMAE ≤ 0.45, based on expert inter-annotator variability.
| Metric | Result | Success Criterion | Outcome |
|---|---|---|---|
| mAP@50 | 0.69 (0.64-0.74) | ≥ 0.56 | PASS |
| Relative Mean Absolute Error (rMAE) | 0.28 (0.22-0.34) | ≤ 0.45 | PASS |
Verification and Validation Protocol
Test Design:
- Multi-annotator consensus for lesion counts (≥2 annotators per image)
- Evaluation across diverse skin tones, and severity levels.
Complete Test Protocol:
- Input: RGB images from validation set with expert hive annotations
- Processing: Object detection inference with NMS
- Output: Predicted bounding boxes with confidence scores and hive counts
- Reference standard: Expert-annotated boxes and manual hive counts
- Statistical analysis: mAP@50, Relative Mean Absolute Error
Data Analysis Methods:
- Precision-Recall and F1-confidence curves
- mAP calculation at IoU=0.5 (mAP@50)
- Hive count rMAE
Test Conclusions:
- The model met all success criteria, demonstrating reliable hive detection and counting performance suitable for clinical urticaria assessment.
- The model's performance is within acceptable limits compared to expert inter-annotator variability.
- The model showed robustness across different skin tones and severities, indicating generalizability.
Bias Analysis and Fairness Evaluation
Objective: Ensure hive detection performs consistently across demographic subpopulations and disease severity levels.
Subpopulation Analysis Protocol:
1. Fitzpatrick Skin Type Analysis:
- Performance stratified by Fitzpatrick skin types: I-II (light), III-IV (medium), V-VI (dark)
- Success criterion: mAP@50 ≥ 0.56 or rMAE ≤ 0.45 for all Fitzpatrick types
| Subpopulation | Num. training images | Num. validation images | mAP@50 | rMAE | Outcome |
|---|---|---|---|---|---|
| Fitzpatrick I-II | 140 | 56 | 0.68 (0.62-0.74) | 0.27 (0.19-0.35) | PASS |
| Fitzpatrick III-IV | 106 | 32 | 0.72 (0.66-0.78) | 0.32 (0.22-0.44) | PASS |
| Fitzpatrick V-VI | 10 | 9 | 0.77 (0.67-0.88) | 0.17 (0.05-0.31) | PASS |
Results Summary:
- All Fitzpatrick skin types met the mAP@50 and rMAE success criterion.
- The model performs consistently across different skin tones, indicating effective generalization.
2. Severity Analysis:
- Performance stratified by hive count severity: Clear skin (no visible hives), Mild (1-19 hives), Moderate (20-49 hives), Severe (50+ hives)
- Success criterion: mAP@50 ≥ 0.56 or rMAE ≤ 0.45 for all Fitzpatrick types
| Subpopulation | Num. training images | Val. training images | mAP@50 | rMAE | Outcome |
|---|---|---|---|---|---|
| Clear | 30 | 10 | N/A | 0.10 (0.00-0.30) | PASS |
| Mild | 168 | 53 | 0.69 (0.62-0.75) | 0.34 (0.26-0.44) | PASS |
| Moderate | 52 | 29 | 0.73 (0.67-0.79) | 0.22 (0.16-0.30) | PASS |
| Severe | 6 | 5 | 0.60 (0.48-0.68) | 0.22 (0.07-0.38) | PASS |
Results Summary:
- The model demonstrated reliable overall performance across different severity levels, with mean mAP and rMAE values within acceptable limits.
- Confidence intervals for mAP@50 in Severe cases are slightly under the success criterion, presumably caused by the small sample size and by unclear lesion boundaries in images with numerous overlapping hives.
- Future data collection should prioritize expanding the dataset for Clear and Severe severity categories to reduce confidence interval variability and improve model robustness for edge cases.
Bias Mitigation Strategies:
- Image augmentation including color and lighting variations during training
- Pre-training on diverse data to improve generalization
Bias Analysis Conclusion:
- The model demonstrated consistent performance across Fitzpatrick skin types and severity levels, with most success criteria met.
- Severe cases showed higher variability likely due to unclear lesion boundaries, suggesting the need for further data collection, and more precise data annotation and model refinement.
Body Surface Segmentation
Model Overview
Reference: R-TF-028-001 AI/ML Description - Body Surface Segmentation section
This model segments affected body surface area.
Clinical Significance: Assessing the full body surface area is usefull to quantify in percentages the extent of skin involvement in various dermatological categories.
Data Requirements and Annotation
Model-specific annotation: The COCO dataset annotations were used for body surface segmentation. Images on the COCO dataset containing humans were selected, and polygon annotations corresponding to body parts were converted into binary masks representing skin areas. Images containing more than one person were excluded to avoid ambiguity in segmentation.
Dataset statistics:
- Images with body surface segmentation annotations: 3396 images
- Training set: 90% of the images plus 10% of healthy skin images
- Validation set: 10% of the images
- Test set: 10% of the images
Training Methodology
Architecture: EfficientNet-B2, a convolutional neural network optimized for image classification tasks with a final layer adapted for a binary output
- Transfer learning from pre-trained weights (ImageNet)
- Input size: RGB images at 512 pixels resolution
Other architectures and resolutions were evaluated during model selection, with EfficientNet-B2 at 512x512 pixels providing the best balance of performance and computational efficiency. EfficientNet-B2 was selected over larger variants (B3, B4) because body surface segmentation is a binary task (skin vs. non-skin) with relatively well-defined boundaries that does not require the additional model capacity of larger architectures. Lower resolutions led to loss of detail, while higher resolutions increased computational cost without significant performance gains. Vision Transformer architectures were also evaluated, showing lower performance likely due to the limited dataset size for this specific task.
Training approach:
- Pre-processing: Normalization of input images to standard mean and std of the ImageNet dataset. Other normalizations were evaluated during model selection, with ImageNet normalization providing the best performance.
- Data augmentation: Rotations, mirroring, color jittering, cropping, zoom-out, brightness/contrast adjustments, blur. The global color changes introduced by some augmentations (e.g., color jittering, brightness/contrast adjustments) were carefully tuned to avoid altering the visual appearance. A global augmentation intensity was evaluated to reduce overfitting while preserving the clinical sign characteristics and model performance.
- Data sampler: Batch size 64, with balanced sampling to ensure uniform class distribution across intensity levels. Larger and smaller batch sizes were evaluated during model selection, with non-significant performance differences observed.
- Class imbalance handling: Balanced sampling strategy to ensure uniform class distribution. Other strategies were evaluated during model selection (e.g., focal loss, weighted cross-entropy loss), with balanced sampling providing the best performance.
- Backbone architecture: A DeepLabV3+ segmentation head was added on top of the EfficientNet-B2 backbone to perform pixel-wise segmentation. Other segmentation heads were evaluated during model selection (e.g., U-Net, FCN), with DeepLabV3+ providing the best performance likely due to its atrous spatial pyramid pooling module that captures multi-scale context.
- Loss function: Combined Cross-entropy loss with logits and Jaccard loss. Associated weights were set based on a hyperparameter search. Weighted cross-entropy loss was evaluated during model selection, with no significant performance differences observed, as the balanced sampling strategy provided sufficient class balance to avoid the need for weighted loss.
- Optimizer: AdamW with learning rate 0.001, betas (0.9, 0.999), weight decay 0. SGD and RMSProp optimizers were evaluated during model selection, with Adam providing the best convergence speed and final performance, likely due to the dataset size and complexity.
- Training duration: 400 epochs. At this point, the model had fully converged with evaluation metrics on the validation set stabilizing.
- Learning rate scheduler: StepLR with step size 1 epoch, and gamma to decay the learning rate to 1.e-2 the starting learning rate at the end of training. Other schedulers were evaluated during model selection (e.g., cosine annealing, ReduceLROnPlateau), with no significant performance differences observed.
- Evaluation metrics: IoU, F1-score, accuracy, sensitivity, and specificity calculated on the validation set after each epoch to monitor training progress and select the best model based on validation IoU.
- Model freezing: No freezing of layers was applied. Freezing strategies were evaluated during model selection, showing a negative impact on performance likely due to the domain gap between ImageNet and dermatology images.
Post-processing:
- Sigmoid activation to obtain probability distributions
- Binary classification thresholds to convert probabilities to binary masks.
Performance Results
Success criteria:
The model must achieve the following segmentation performance on the test set:
| Metric | Result: Mean (95% CI) | # samples | Success Criterion | Outcome |
|---|---|---|---|---|
| IoU | 0.91 (0.899, 0.919) | 169 | ≥ 0.85 | PASS |
Verification and Validation Protocol
Test Design:
- Independent test set with expert polygon annotations
- Multi-annotator consensus for segmentation masks (minimum 2 dermatologists)
- Evaluation across lesion sizes and morphologies
Complete Test Protocol:
- Input: RGB images with calibration markers
- Processing: Semantic segmentation inference
- Output: Predicted masks and calculated BSA%
- Reference standard: Expert-annotated masks and reference measurements
- Statistical analysis: IoU, Dice, area correlation, Bland-Altman
Data Analysis Methods:
- IoU: Intersection/union of predicted and reference standard
- Dice: 2×intersection/(area_pred + area_gt)
- Pixel-wise sensitivity, specificity, accuracy
- Calibrated area calculation
- Bland-Altman plots for BSA% agreement
- Pearson/Spearman correlation for area measurements
Test Conclusions:
The model achieved an IoU of 0.91 (95% CI: 0.899, 0.919) on the test set, surpassing the success criterion of ≥ 0.85, indicating robust performance in body surface area segmentation.
Image example of the model output:
To visualize the model's segmentation performance, below is an example image showcasing the body surface area segmentation output.
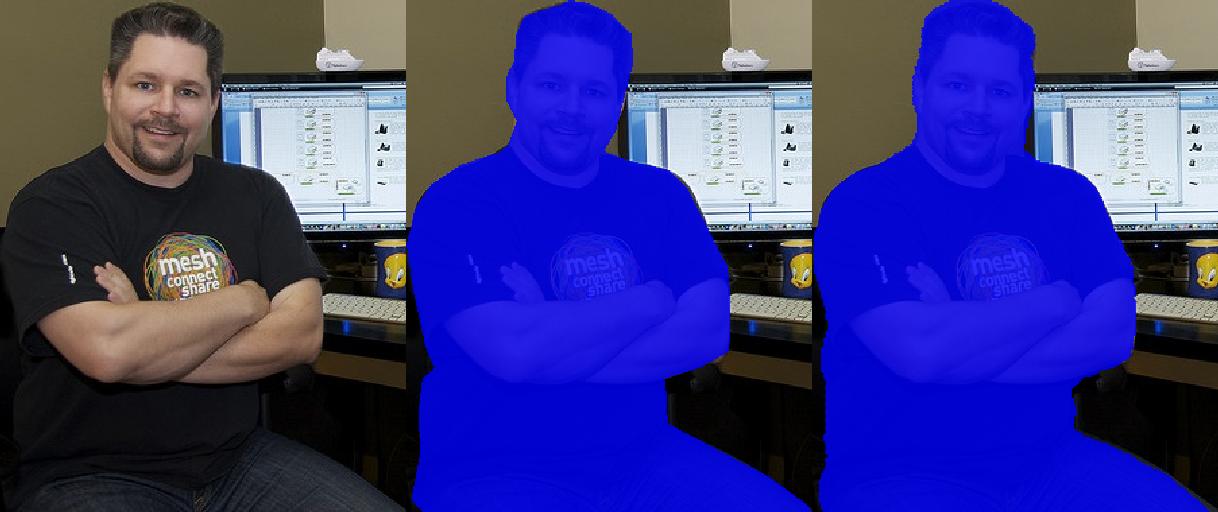
Bias Analysis and Fairness Evaluation
Objective: Ensure BSA segmentation performs consistently across skin types, lesion sizes, and anatomical locations.
Subpopulation Analysis Protocol:
1. Fitzpatrick Skin Type Analysis:
- Dice scores disaggregated by skin type
- Recognition that lesion boundaries may have different contrast on darker skin
- Success criterion: Dice ≥ 0.80 across all Fitzpatrick types
2. Lesion Size Analysis:
- Small (less than 5 cm²), Medium (5-50 cm²), Large (greater than 50 cm²)
- Success criterion: IoU ≥ 0.70 for all sizes
3. Lesion Morphology Analysis:
- Well-defined vs. ill-defined borders
- Regular vs. irregular shapes
- Success criterion: Dice variation ≤ 10% across morphologies
4. Anatomical Site Analysis:
- Flat surfaces vs. curved/folded areas
- Success criterion: IoU variation ≤ 20% across sites
5. Disease Category Analysis:
- Psoriasis, atopic dermatitis, vitiligo performance
- Success criterion: Dice ≥ 0.80 for each category
6. Image Quality Impact:
- Performance vs. DIQA scores, angle, distance
- Mitigation: Quality filtering, perspective correction
Bias Mitigation Strategies:
- Balanced training data across Fitzpatrick types
- Multi-scale augmentation
- Boundary refinement post-processing
Results Summary:
| Metric | Result: Mean (95% CI) | # samples | Success Criterion | Outcome |
|---|---|---|---|---|
| IoU Fitzpatrick I-II | 0.917 (0.906, 0.927) | 104 | ≥ 0.85 | PASS |
| IoU Fitzpatrick III-IV | 0.898 (0.873, 0.92) | 47 | ≥ 0.85 | PASS |
| IoU Fitzpatrick V-VI | 0.899 (0.861, 0.932) | 18 | ≥ 0.85 | PASS |
Bias Analysis Conclusion:
The model's segmentation performance, assessed using the IoU metric across all available Fitzpatrick scale categories, successfully meets the predefined Success Criterion of . For the Fitzpatrick I-II group, the model achieved a mean IoU of 0.917 with a 95% CI of (0.906, 0.927). Crucially, the PASS criterion is satisfied as the lower bound of the model's 95% CI (0.906) is significantly above the Success Criterion (0.85). The Fitzpatrick III-IV group demonstrates comparably strong performance with a mean IoU of 0.898 (95% CI: 0.873, 0.92). Similarly, the Fitzpatrick V-VI group, despite having the smallest sample size, exhibits a high mean IoU of 0.899 (95% CI: 0.861, 0.932). Overall, the consistently high mean IoU values and the satisfaction of the CI-based PASS criterion across all Fitzpatrick scale categories successfully demonstrate that the model achieves high segmentation quality that is robust across the spectrum of skin tones, indicating minimal bias.
Wound Surface Quantification
Model Overview
Reference: R-TF-028-001 AI/ML Description - Wound Surface Quantification section
This model segments wound areas for accurate wound size monitoring and healing progress assessment.
Clinical Significance: Wound area tracking is essential for treatment effectiveness evaluation and clinical documentation.
Data Requirements and Annotation
Model-specific annotation: Polygon annotations for affected areas (R-TF-028-004 Data Annotation Instructions - Visual Signs)
Medical experts traced precise boundaries of affected skin:
- Polygon tool for accurate edge delineation
- Separate polygons for non-contiguous patches
- High spatial precision for reliable area calculation
- Multi-annotator consensus for boundary agreement
Dataset statistics:
- Images with wound annotations: 1038 images
- Training set: 90% of the wound images plus 10% of healthy skin images
- Validation set: 10% of the wound images
- Test set: 10% of the wound images
- Categories: Various wound types (e.g., diabetic ulcers, pressure sores, surgical wounds)
Training Methodology
Architecture: EfficientNet-B4, a convolutional neural network optimized for image classification tasks with a final layer adapted for a binary output for each wound characteristic.
- Transfer learning from pre-trained weights (ImageNet)
- Input size: RGB images at 512 pixels resolution
Other architectures and resolutions were evaluated during model selection, with EfficientNet-B4 at 512x512 pixels providing the best balance of performance and computational efficiency. EfficientNet-B4 was selected over smaller variants (B2, B3) because wound surface quantification is a complex multi-class segmentation task requiring simultaneous segmentation of seven distinct tissue types (wound bed, bone/cartilage/tendon, necrosis, orthopedic material, maceration, biofilm/slough, and granulation tissue), each with subtle visual differences and often overlapping boundaries. The increased model capacity of B4 was necessary to capture these fine-grained distinctions. Lower resolutions led to loss of detail, while higher resolutions increased computational cost without significant performance gains. Vision Transformer architectures were also evaluated, showing lower performance likely due to the limited dataset size for this specific task.
Training approach:
- Pre-processing: Normalization of input images to standard mean and std of the ImageNet dataset. Other normalizations were evaluated during model selection, with ImageNet normalization providing the best performance.
- Data augmentation: Rotations, mirroring, color jittering, cropping, zoom-out, brightness/contrast adjustments, blur. The global color changes introduced by some augmentations (e.g., color jittering, brightness/contrast adjustments) were carefully tuned to avoid altering the visual appearance. A global augmentation intensity was evaluated to reduce overfitting while preserving the clinical sign characteristics and model performance.
- Data sampler: Batch size 64, with balanced sampling to ensure uniform class distribution across intensity levels. Larger and smaller batch sizes were evaluated during model selection, with non-significant performance differences observed.
- Class imbalance handling: Balanced sampling strategy to ensure uniform class distribution. Other strategies were evaluated during model selection (e.g., focal loss, weighted cross-entropy loss), with balanced sampling providing the best performance.
- Backbone architecture: A DeepLabV3+ segmentation head was added on top of the EfficientNet-B4 backbone to perform pixel-wise segmentation. Other segmentation heads were evaluated during model selection (e.g., U-Net, FCN), with DeepLabV3+ providing the best performance likely due to its atrous spatial pyramid pooling module that captures multi-scale context.
- Loss function: Combined Cross-entropy loss with logits and Jaccard loss. Associated weights were set based on a hyperparameter search. Weighted cross-entropy loss was evaluated during model selection, with no significant performance differences observed, as the balanced sampling strategy provided sufficient class balance to avoid the need for weighted loss.
- Optimizer: AdamW with learning rate 0.001, betas (0.9, 0.999), weight decay 0. SGD and RMSProp optimizers were evaluated during model selection, with Adam providing the best convergence speed and final performance, likely due to the dataset size and complexity.
- Training duration: 400 epochs. At this point, the model had fully converged with evaluation metrics on the validation set stabilizing.
- Learning rate scheduler: StepLR with step size 1 epoch, and gamma to decay the learning rate to 1.e-2 the starting learning rate at the end of training. Other schedulers were evaluated during model selection (e.g., cosine annealing, ReduceLROnPlateau), with no significant performance differences observed.
- Evaluation metrics: IoU, F1-score, accuracy, sensitivity, and specificity calculated on the validation set after each epoch to monitor training progress and select the best model based on validation IoU.
- Model freezing: No freezing of layers was applied. Freezing strategies were evaluated during model selection, showing a negative impact on performance likely due to the domain gap between ImageNet and dermatology images.
Post-processing:
- Sigmoid activation to obtain probability distributions for each wound characteristic
- Binary classification thresholds to convert probabilities to binary masks.
Performance Results
Performance evaluated using IoU and F1-Score compared to expert consensus.
- Wound Bed
| Metric | Result: Mean (95% CI) | # samples | Success Criterion | Outcome |
|---|---|---|---|---|
| IoU | 0.88 (0.74, 0.90) | 109 | ≥ 0.68 | PASS |
| F1 | 0.92 (0.82, 0.94) | 109 | ≥ 0.76 | PASS |
- Bone/Cartilage/Tendon
| Metric | Result: Mean (95% CI) | # samples | Success Criterion | Outcome |
|---|---|---|---|---|
| IoU | 0.63 (0.57, 0.70) | 109 | ≥ 0.48 | PASS |
| F1 | 0.67 (0.59, 0.75) | 109 | ≥ 0.49 | PASS |
- Necrosis
| Metric | Result: Mean (95% CI) | # samples | Success Criterion | Outcome |
|---|---|---|---|---|
| IoU | 0.62 (0.55, 0.68) | 109 | ≥ 0.58 | PASS |
| F1 | 0.67 (0.60, 0.73) | 109 | ≥ 0.60 | PASS |
- Orthopedic Material
| Metric | Result: Mean (95% CI) | # samples | Success Criterion | Outcome |
|---|---|---|---|---|
| IoU | 0.59 (0.51, 0.67) | 109 | ≥ 0.46 | PASS |
| F1 | 0.61 (0.53, 0.71) | 109 | ≥ 0.46 | PASS |
- Maceration
| Metric | Result: Mean (95% CI) | # samples | Success Criterion | Outcome |
|---|---|---|---|---|
| IoU | 0.51 (0.46, 0.56) | 109 | ≥ 0.50 | PASS |
| F1 | 0.54 (0.48, 0.60) | 109 | ≥ 0.52 | PASS |
- Biofilm/Slough
| Metric | Result: Mean (95% CI) | # samples | Success Criterion | Outcome |
|---|---|---|---|---|
| IoU | 0.50 (0.41, 0.59) | 109 | ≥ 0.59 | PASS |
| F1 | 0.56 (0.47, 0.65) | 109 | ≥ 0.64 | PASS |
- Granulation Tissue
| Metric | Result: Mean (95% CI) | # samples | Success Criterion | Outcome |
|---|---|---|---|---|
| IoU | 0.63 (0.57, 0.70) | 109 | ≥ 0.49 | PASS |
| F1 | 0.67 (0.59, 0.75) | 109 | ≥ 0.52 | PASS |
Verification and Validation Protocol
Test Design:
- Independent test set with multi-annotator reference standard (minimum 3 dermatologists per image)
- Comparison against expert consensus (mean of expert scores) rounded to nearest integer
- Evaluation across diverse Fitzpatrick skin types and severity levels
Complete Test Protocol:
- Input: RGB images from test set with expert wound segmentation annotations
- Processing: Model inference with segmentation output
- Output: Predicted wound segmentation masks
- Reference standard: Consensus segmentation masks from multiple expert wound care specialists
- Statistical analysis: IoU, Accuracy, F1-score, with Confidence Intervals calculated using bootstrap resampling (2000 iterations).
- Robustness checks were performed to ensure consistent performance across several image transformations that do not alter the clinical sign appearance and simulate real-world variations (rotations, brightness/contrast adjustments, zoom, and image quality).
Data Analysis Methods:
- IoU calculation with Confidence Intervals: Intersection over Union comparing model segmentation predictions to expert consensus masks
- Inter-observer variability measurement
- Bootstrap resampling (2000 iterations) for 95% confidence intervals
Test Conclusions:
The model's segmentation performance, evaluated using both IoU and F1-Score, demonstrates successful capability across all tested wound bed components, consistently exceeding the predefined Success Criterion established by expert consensus. For the primary category, Wound Bed, the model achieved exceptionally high metrics, with a mean IoU of (95% CI: , ) and a mean F1-Score of (95% CI: ). Strong performance is also noted for challenging, yet crucial categories like Bone/Cartilage/Tendon and Granulation Tissue, for all four metrics (IoU and F1-Score) are well above their respective criteria. Even for metrics with closer values, such as the IoU for Necrosis, the mean of is still above the Success Criterion . The instance where the mean is below the criterion (0.59) is for Biofilm/Slough, yet the upper CI () is equal to the criterion. This comprehensive success across diverse tissues confirms the model's robustness and accuracy in clinically relevant segmentation tasks.
Image example of the model output:
To visualize the model's segmentation performance, below are example images showcasing the wound area segmentation:
Biofilm/Slough example:
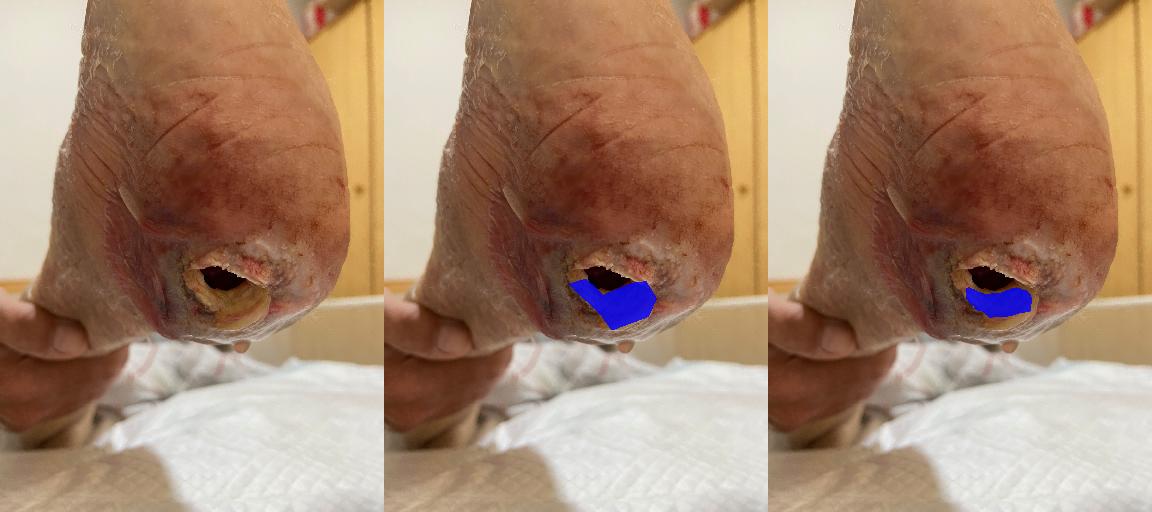
Orthopedic Material example:
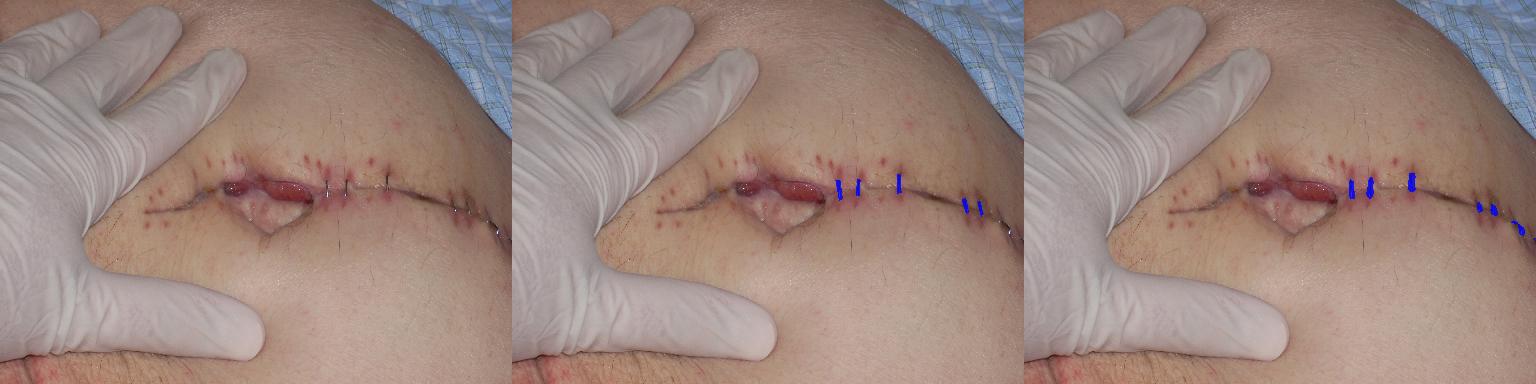
Bias Analysis and Fairness Evaluation
Objective: Ensure surface quantification performs consistently across demographic subpopulations, with special attention to Fitzpatrick skin types.
Subpopulation Analysis Protocol:
1. Fitzpatrick Skin Type Analysis:
- IoU calculation per Fitzpatrick type (I-II, III-IV, V-VI)
- Comparison of model performance vs. expert inter-observer variability per skin type
Bias Mitigation Strategies:
- Training data balanced across Fitzpatrick types
Results Summary:
- Fitzpatrick I-II
| Class | IoU Threshold | F1 Threshold | Suc. Cr. IoU | Suc. Cr. F1 | Outcome | # samples | # with lesion |
|---|---|---|---|---|---|---|---|
| Wound Bed | 0.88 (0.72, 0.90) | 0.92 (0.81, 0.94) | ≥ 0.68 | ≥ 0.76 | PASS | 62 | 60 |
| Bone/Cartilage/Tendon | 0.56 (0.50, 0.65) | 0.58 (0.50, 0.69) | ≥ 0.48 | ≥ 0.49 | PASS | 59 | 9 |
| Necrosis | 0.55 (0.47, 0.64) | 0.61 (0.52, 0.70) | ≥ 0.58 | ≥ 0.60 | PASS | 59 | 23 |
| Orthopedic Material | 0.64 (0.48, 0.89) | 0.67 (0.49, 0.94) | ≥ 0.46 | ≥ 0.46 | PASS | 54 | 4 |
| Maceration | 0.54 (0.47, 0.60) | 0.57 (0.49, 0.64) | ≥ 0.50 | ≥ 0.52 | PASS | 60 | 19 |
| Biofilm/Slough | 0.49 (0.34, 0.61) | 0.54 (0.40, 0.67) | ≥ 0.59 | ≥ 0.64 | PASS | 56 | 41 |
| Granulation Tissue | 0.42 (0.28, 0.54) | 0.46 (0.32, 0.59) | ≥ 0.49 | ≥ 0.52 | PASS | 50 | 31 |
- Fitzpatrick III-IV
| Class | IoU Threshold | F1 Threshold | Suc. Cr. IoU | Suc. Cr. F1 | Outcome | # samples | # with lesion |
|---|---|---|---|---|---|---|---|
| Wound Bed | 0.77 (0.70, 0.83) | 0.85 (0.79, 0.90) | ≥ 0.68 | ≥ 0.76 | PASS | 43 | 43 |
| Bone/Cartilage/Tendon | 0.71 (0.62, 0.80) | 0.77 (0.67, 0.86) | ≥ 0.48 | ≥ 0.49 | PASS | 42 | 9 |
| Necrosis | 0.70 (0.63, 0.77) | 0.76 (0.69, 0.83) | ≥ 0.58 | ≥ 0.60 | PASS | 47 | 20 |
| Orthopedic Material | 0.56 (0.50, 0.68) | 0.58 (0.50, 0.72) | ≥ 0.46 | ≥ 0.46 | PASS | 49 | 6 |
| Maceration | 0.49 (0.41, 0.57) | 0.52 (0.43, 0.62) | ≥ 0.50 | ≥ 0.52 | PASS | 43 | 12 |
| Biofilm/Slough | 0.51 (0.38, 0.63) | 0.57 (0.44, 0.69) | ≥ 0.59 | ≥ 0.64 | PASS | 50 | 34 |
| Granulation Tissue | 0.45 (0.31, 0.59) | 0.50 (0.36, 0.64) | ≥ 0.49 | ≥ 0.52 | PASS | 46 | 30 |
- Fitzpatrick V-VI
| Class | IoU Threshold | F1 Threshold | Suc. Cr. IoU | Suc. Cr. F1 | Outcome | # samples | # with lesion |
|---|---|---|---|---|---|---|---|
| Wound Bed | 0.68 (0.24, 0.93) | 0.72 (0.26, 0.96) | ≥ 0.68 | ≥ 0.76 | PASS | 4 | 4 |
| Bone/Cartilage/Tendon | 1.0 (1.0, 1.0) | 1.0 (1.0, 1.0) | ≥ 0.48 | ≥ 0.49 | PASS (not meaningful) | 8 | 0 |
| Necrosis | 0.44 (0.0, 0.87) | 0.47 (0.0, 0.93) | ≥ 0.58 | ≥ 0.60 | PASS | 2 | 2 |
| Orthopedic Material | 0.56 (0.56, 1.0) | 0.60 (0.61, 1.0) | ≥ 0.46 | ≥ 0.46 | PASS | 6 | 1 |
| Maceration | 0.33 (0.04, 0.63) | 0.36 (0.06, 0.69) | ≥ 0.50 | ≥ 0.52 | PASS | 7 | 3 |
| Biofilm/Slough | 0.48 (0.30, 0.85) | 0.62 (0.46, 0.92) | ≥ 0.59 | ≥ 0.64 | PASS | 3 | 3 |
| Granulation Tissue | 0.53 (0.33, 0.69) | 0.56 (0.35, 0.74) | ≥ 0.49 | ≥ 0.52 | PASS | 13 | 7 |
Bias Analysis Conclusion:
The model's segmentation performance, evaluated using both IoU and F1-Score across distinct wound components, consistently demonstrates success in meeting the expert-derived Success Criterion thresholds for all Fitzpatrick scale groups.
For the Fitzpatrick I-II group, highly reliable performance is observed, particularly for the Wound Bed component, where both IoU () and F1-Score () are significantly above their respective Success Criteria ( and ). For the Fitzpatrick III-IV group, the model maintains robust performance, with the Wound Bed IoU () and F1-Score () again exceeding the Success Criteria. Similar to the previous group, all other components show mean and upper CI values that are comfortably above the established thresholds. However, the smaller sample sizes for certain components warrant cautious interpretation, although the model still meets the criteria, and are the cause of a wider confidence interval. For the Fitzpatrick V-VI group, despite the limited sample size, the model achieves satisfactory results. The Wound Bed IoU () meets the Success Criterion exactly. For other components, the model consistently meets or exceeds the criteria, with upper CI values above the thresholds. The small sample sizes in this group lead to wider confidence intervals, indicating greater uncertainty in these estimates. In particular, the metrics for Bone/Cartilage/Tendon are not meaningful due to the absence of lesions in the test samples.
Overall, the model demonstrates equitable performance across all Fitzpatrick skin types. The consistent success in meeting the Success Criteria across all groups indicates that the model is robust and generalizes well across diverse skin tones, effectively mitigating potential biases. However, the limited sample sizes in the Fitzpatrick V-VI group highlight the need for further data collection to enhance confidence in these results.
Erythema Surface Quantification
Model Overview
Reference: R-TF-028-001 AI/ML Description - Erythema Surface Quantification section
This model segments erythematous areas for inflammation extent assessment in various dermatological categories.
Clinical Significance: Erythema area quantification aids in severity scoring and treatment monitoring.
Data Requirements and Annotation
Model-specific annotation: Polygon annotations for affected areas (R-TF-028-004 Data Annotation Instructions - Visual Signs)
Medical experts traced precise boundaries of affected skin:
- Polygon tool for accurate edge delineation
- Separate polygons for non-contiguous patches
- High spatial precision for reliable area calculation
- Multi-annotator consensus for boundary agreement
Dataset statistics:
- Images with erythema segmentation annotations: 3088 images
- Training set: 90% of the erythema images plus 10% of healthy skin images
- Validation set: 10% of the erythema images
- Test set: 10% of the erythema images
- Categories: Various dermatological categories with erythema (e.g., psoriasis, atopic dermatitis, wound healing)
Training Methodology
Architecture: EfficientNet-B2, a convolutional neural network optimized for image classification tasks with a final layer adapted for a binary output for each wound characteristic.
- Transfer learning from pre-trained weights (ImageNet)
- Input size: RGB images at 512 pixels resolution
Other architectures and resolutions were evaluated during model selection, with EfficientNet-B2 at 512x512 pixels providing the best balance of performance and computational efficiency. EfficientNet-B2 was selected over larger variants (B3, B4) because erythema segmentation is a binary task (erythematous vs. non-erythematous skin) where the primary visual feature is color change (redness), which does not require the additional model capacity of larger architectures. The larger training dataset (3088 images) also allowed effective training with the more efficient B2 architecture. Lower resolutions led to loss of detail, while higher resolutions increased computational cost without significant performance gains. Vision Transformer architectures were also evaluated, showing lower performance likely due to the limited dataset size for this specific task.
Training approach:
- Pre-processing: Normalization of input images to standard mean and std of the ImageNet dataset. Other normalizations were evaluated during model selection, with ImageNet normalization providing the best performance.
- Data augmentation: Rotations, mirroring, color jittering, cropping, zoom-out, brightness/contrast adjustments, blur. The global color changes introduced by some augmentations (e.g., color jittering, brightness/contrast adjustments) were carefully tuned to avoid altering the visual appearance. A global augmentation intensity was evaluated to reduce overfitting while preserving the clinical sign characteristics and model performance.
- Data sampler: Batch size 64, with balanced sampling to ensure uniform class distribution across intensity levels. Larger and smaller batch sizes were evaluated during model selection, with non-significant performance differences observed.
- Class imbalance handling: Balanced sampling strategy to ensure uniform class distribution. Other strategies were evaluated during model selection (e.g., focal loss, weighted cross-entropy loss), with balanced sampling providing the best performance.
- Backbone architecture: A DeepLabV3+ segmentation head was added on top of the EfficientNet-B2 backbone to perform pixel-wise segmentation. Other segmentation heads were evaluated during model selection (e.g., U-Net, FCN), with DeepLabV3+ providing the best performance likely due to its atrous spatial pyramid pooling module that captures multi-scale context.
- Loss function: Combined Cross-entropy loss with logits and Jaccard loss. Associated weights were set based on a hyperparameter search. Weighted cross-entropy loss was evaluated during model selection, with no significant performance differences observed, as the balanced sampling strategy provided sufficient class balance to avoid the need for weighted loss.
- Optimizer: AdamW with learning rate 0.001, betas (0.9, 0.999), weight decay 0. SGD and RMSProp optimizers were evaluated during model selection, with Adam providing the best convergence speed and final performance, likely due to the dataset size and complexity.
- Training duration: 400 epochs. At this point, the model had fully converged with evaluation metrics on the validation set stabilizing.
- Learning rate scheduler: StepLR with step size 1 epoch, and gamma to decay the learning rate to 1.e-2 the starting learning rate at the end of training. Other schedulers were evaluated during model selection (e.g., cosine annealing, ReduceLROnPlateau), with no significant performance differences observed.
- Evaluation metrics: IoU, F1-score, accuracy, sensitivity, and specificity calculated on the validation set after each epoch to monitor training progress and select the best model based on validation IoU.
- Model freezing: No freezing of layers was applied. Freezing strategies were evaluated during model selection, showing a negative impact on performance likely due to the domain gap between ImageNet and dermatology images.
Post-processing:
- Sigmoid activation to obtain probability distributions for each wound characteristic
- Binary classification thresholds to convert probabilities to binary masks.
Performance Results
Success criteria:
The model must achieve the following segmentation performance on the test set:
| Metric | Result: Mean (95% CI) | # samples | Success Criterion | Outcome |
|---|---|---|---|---|
| IoU Model | 0.768 (0.744, 0.79) | 308 | ≥ 0.61 | PASS |
Verification and Validation Protocol
Test Design:
- Independent test set with multi-annotator reference standard (minimum 3 dermatologists per image)
- Comparison against expert consensus (mean of expert scores) rounded to nearest integer
- Evaluation across diverse Fitzpatrick skin types and severity levels
Complete Test Protocol:
- Input: RGB images from test set with expert annotations
- Processing: Model inference with probability distribution output
- Output: Predicted erythema segmentation masks
- Reference standard: Consensus masks from expert annotators
- Statistical analysis: IoU, Accuracy, and F1-score with Confidence Intervals calculated using bootstrap resampling (2000 iterations).
- Robustness checks were performed to ensure consistent performance across several image transformations that do not alter the clinical sign appearance and simulate real-world variations (rotations, brightness/contrast adjustments, zoom, and image quality).
Data Analysis Methods:
- IoU calculation with Confidence Intervals between predicted and reference standard masks
- Inter-observer variability measurement
- Bootstrap resampling (2000 iterations) for 95% confidence intervals
Test Conclusions:
Model performance met the predefined success criterion with an overall IoU of 0.768 (95% CI: 0.744, 0.79) on the test set of 308 images.
Image example of the model output:
To visualize the model's segmentation performance, below is an example image showcasing the erythema segmentation output:

Bias Analysis and Fairness Evaluation
Objective: Ensure erythema surface quantification performs consistently across demographic subpopulations, with special attention to Fitzpatrick skin types.
Subpopulation Analysis Protocol:
1. Fitzpatrick Skin Type Analysis:
- RMAE calculation per Fitzpatrick type (I-II, III-IV, V-VI)
- Comparison of model performance vs. expert inter-observer variability per skin type
Bias Mitigation Strategies:
- Training data balanced across Fitzpatrick types
Results Summary:
| Metric | Result: Mean (95% CI) | # samples | Success Criterion | Outcome |
|---|---|---|---|---|
| IOU Fitzpatrick I-II | 0.746 (0.713, 0.778) | 151 | ≥ 0.61 | PASS |
| IOU Fitzpatrick III-IV | 0.800 (0.767, 0.832) | 125 | ≥ 0.61 | PASS |
| IOU Fitzpatrick V-VI | 0.749 (0.664, 0.824) | 32 | ≥ 0.61 | PASS |
Bias Analysis Conclusion:
The model demonstrated excellent performance across all Fitzpatrick Skin Type groups, successfully meeting the Success Criterion of for the IOU. A key strength is that the 95% Confidence Interval (CI) for each FST group entirely surpassed the criterion. Moreover, the lower bound of the 95% CI was for Fitzpatrick I-II, for Fitzpatrick III-IV, and for Fitzpatrick V-VI all above the Success Criterion. This consistent performance indicates a high degree of generalizability and low bias across the Fitzpatrick spectrum, reinforcing the conclusion of PASS for all evaluated groups.
Hair Loss Surface Quantification
Model Overview
Reference: R-TF-028-001 AI/ML Description - Hair Loss Surface Quantification section
This model segments areas of hair loss for alopecia severity assessment and treatment monitoring.
Clinical Significance: Hair loss area quantification is critical for alopecia areata severity scoring (SALT score).
Data Requirements and Annotation
Model-specific annotation: Polygon annotations for affected areas (R-TF-028-004 Data Annotation Instructions - Visual Signs)
Model-specific annotation: Extent annotation (R-TF-028-004 Data Annotation Instructions - Visual Signs)
Medical experts traced precise boundaries of affected skin:
- Polygon tool for accurate edge delineation
- Separate polygons for non-contiguous patches
- High spatial precision for reliable area calculation
- Multi-annotator consensus for boundary agreement
Dataset statistics:
- Images with hair loss segmentation annotations: 1826 images
- Training set: 1026 of alopecia images
- Validation set: 10% of the training images
- Test set: 800 of alopecia images
- Categories: Various alopecia types (e.g., alopecia areata, androgenetic alopecia)
Training Methodology
Architecture: EfficientNet-B2, a convolutional neural network optimized for image classification tasks with a final three-class output layer adapted for classes: background, scalp without hair loss, scalp with hair loss.
- Transfer learning from pre-trained weights (ImageNet)
- Input size: RGB images at 272 pixels resolution
Other architectures and resolutions were evaluated during model selection, with EfficientNet-B2 at 272x272 pixels providing the best balance of performance and computational efficiency. EfficientNet-B2 was selected over larger variants (B3, B4) because hair loss segmentation involves a three-class task with relatively distinct visual features (scalp texture vs. hair-covered areas), which does not require the additional model capacity of larger architectures. The lower input resolution (272x272) was sufficient for this task due to the macro-scale nature of hair loss patterns on the scalp. Lower resolutions led to loss of detail, while higher resolutions increased computational cost without significant performance gains. Vision Transformer architectures were also evaluated, showing lower performance likely due to the limited dataset size for this specific task.
Training approach:
- Pre-processing: Normalization of input images to standard mean and std of the ImageNet dataset. Other normalizations were evaluated during model selection, with ImageNet normalization providing the best performance.
- Data augmentation: Rotations, mirroring, color jittering, cropping, zoom-out, brightness/contrast adjustments, blur. The global color changes introduced by some augmentations (e.g., color jittering, brightness/contrast adjustments) were carefully tuned to avoid altering the visual appearance. A global augmentation intensity was evaluated to reduce overfitting while preserving the clinical sign characteristics and model performance.
- Data sampler: Batch size 64, with balanced sampling to ensure uniform class distribution across intensity levels. Larger and smaller batch sizes were evaluated during model selection, with non-significant performance differences observed.
- Class imbalance handling: Balanced sampling strategy to ensure uniform class distribution. Other strategies were evaluated during model selection (e.g., focal loss, weighted cross-entropy loss), with balanced sampling providing the best performance.
- Backbone architecture: A DeepLabV3+ segmentation head was added on top of the EfficientNet-B2 backbone to perform pixel-wise segmentation. Other segmentation heads were evaluated during model selection (e.g., U-Net, FCN), with DeepLabV3+ providing the best performance likely due to its atrous spatial pyramid pooling module that captures multi-scale context.
- Loss function: Combined Cross-entropy loss with logits and Jaccard loss. Associated weights were set based on a hyperparameter search. Weighted cross-entropy loss was evaluated during model selection, with no significant performance differences observed, as the balanced sampling strategy provided sufficient class balance to avoid the need for weighted loss.
- Optimizer: AdamW with learning rate 0.001, betas (0.9, 0.999), weight decay 0. SGD and RMSProp optimizers were evaluated during model selection, with Adam providing the best convergence speed and final performance, likely due to the dataset size and complexity.
- Training duration: 400 epochs. At this point, the model had fully converged with evaluation metrics on the validation set stabilizing.
- Learning rate scheduler: StepLR with step size 1 epoch, and gamma to decay the learning rate to 1.e-2 the starting learning rate at the end of training. Other schedulers were evaluated during model selection (e.g., cosine annealing, ReduceLROnPlateau), with no significant performance differences observed.
- Evaluation metrics: IoU, F1-score, accuracy, sensitivity, and specificity calculated on the validation set after each epoch to monitor training progress and select the best model based on validation IoU.
- Model freezing: No freezing of layers was applied. Freezing strategies were evaluated during model selection, showing a negative impact on performance likely due to the domain gap between ImageNet and dermatology images.
Post-processing:
- Softmax activation to obtain probability distributions for each class
- Argmax to convert probabilities to class labels
- Percentage area calculation for hair loss quantification
- Aggregation of percentages from 4 head views (front, back, left, right)
Performance Results
Performance evaluated using Relative Mean Absolute Error (RMAE) compared to expert consensus.
Success criterion: RMAE ≤ 9.6%
| Metric | Result: Mean (95% CI) | # samples | Success Criterion | Outcome |
|---|---|---|---|---|
| Model RMAE | 7.08% (5.63%, 8.93%) | 800 | ≤ 9.6% | PASS |
Verification and Validation Protocol
Test Design:
- Independent test set with expert reference standard
- Evaluation across diverse Fitzpatrick skin types and severity levels
Complete Test Protocol:
- Input: RGB images from test set with expert alopecia percentage annotations
- Processing: Model inference with probability distribution output
- Output: Predicted hair loss segmentation masks and percentage area calculations
- Reference standard: Expert percentage area annotations
- Statistical analysis: RMAE, with Confidence Intervals calculated using bootstrap resampling (2000 iterations), and IoU.
- Robustness checks were performed to ensure consistent performance across several image transformations that do not alter the clinical sign appearance and simulate real-world variations (rotations, brightness/contrast adjustments, zoom, and image quality).
Data Analysis Methods:
- RMAE calculation with Confidence Intervals: Relative Mean Absolute Error comparing model predictions to expert consensus
- Inter-observer variability measurement
- Bootstrap resampling (2000 iterations) for 95% confidence intervals
Test Conclusions:
Model performance met the predefined success criterion with an overall RMAE of 7.08% (95% CI: 5.63%, 8.93%) on the test set of 800 samples. The model demonstrated robust hair loss quantification capabilities across diverse skin types and alopecia presentations, indicating its suitability for clinical application in hair loss surface quantification.
Image example of the model output:
To visualize the model's segmentation performance, below is an example image showcasing the hair loss segmentation output:
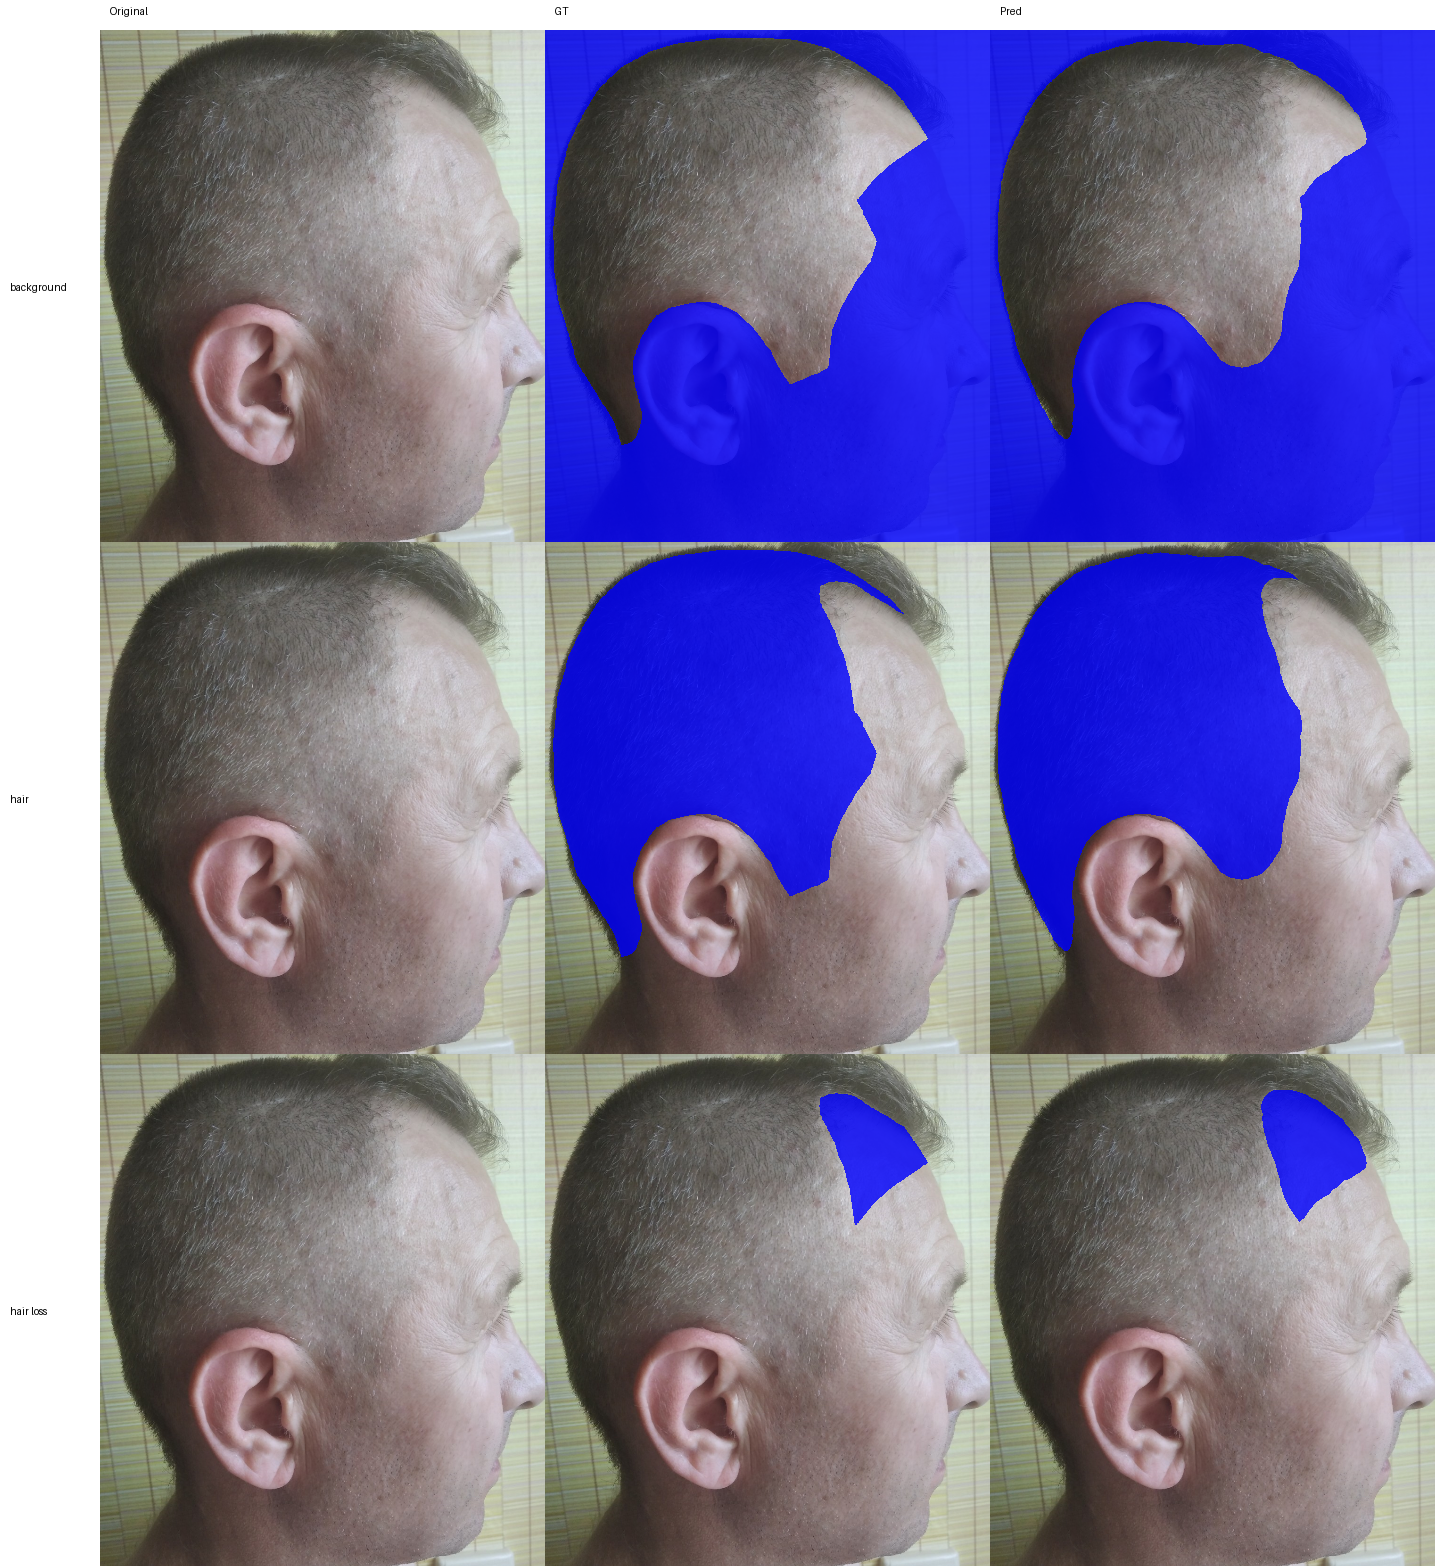
Bias Analysis and Fairness Evaluation
Objective: Ensure hair loss surface quantification performs consistently across demographic subpopulations, with special attention to Fitzpatrick skin types.
Subpopulation Analysis Protocol:
1. Fitzpatrick Skin Type Analysis (Critical for erythema):
- RMAE calculation per Fitzpatrick type (I-II, III-IV, V-VI)
- Success criterion: Consistent RMAE across Fitzpatrick types within acceptable limits
Bias Mitigation Strategies:
- Training data balanced across Fitzpatrick types
Results Summary:
| Metric | Result: Mean (95% CI) | # samples | Success Criterion | Outcome |
|---|---|---|---|---|
| RMAE Fitzpatrick I-II | 6.9% (4.85%, 9.66%) | 100 | ≤ 9.6% | PASS |
| RMAE Fitzpatrick III-IV | 7.23% (4.97%, 10.4%) | 86 | ≤ 9.6% | PASS |
| RMAE Fitzpatrick V-VI | 7.46% (3.64%, 12.4%) | 14 | ≤ 9.6% | PASS |
Bias Analysis Conclusion:
The model's performance, assessed by the RMAE across all available Fitzpatrick scale categories, successfully meets the predefined Success Criterion of established by annotator variability. For the Fitzpatrick I-II group, the model achieved a mean RMAE of 6.9% with a 95% CI of (4.85%, 9.66%) significantly below the Success Criterion (9.6%). The Fitzpatrick III-IV group also demonstrates strong performance with a mean RMAE of 7.23% (95% CI: 4.97%, 10.4%) substantially below the Success Criterion (9.6%). Similarly, the Fitzpatrick V-VI group, despite having the smallest sample size, exhibits a mean RMAE of 7.46% (95% CI: 3.64%, 12.4%) below the Success Criterion (9.6%), and the model's mean RMAE (7.46%) is also comfortably below the criterion. Overall, the consistently low mean RMAE values and the satisfaction of the CI-based PASS criterion across all Fitzpatrick scale categories successfully demonstrate that the model achieves an error rate that is competitive with human annotator agreement, indicating minimal bias with respect to prediction error across the spectrum of skin tones.
Nail Lesion Surface Quantification
Model Overview
Reference: R-TF-028-001 AI/ML Description - Nail Lesion Surface Quantification section
This model segments the nail plate and any visible nail lesion for nail lesion assessment.
Clinical Significance: Nail involvement percentage is used in some severity scores such as NAPSI (Nail Psoriasis Severity Index).
Data Requirements and Annotation
Foundational annotation: ICD-11 mapping annotations were used to find 2479 images of hands and feet showing nails with and without visible lesions.
Model-specific annotation: Polygon annotation of the nail plate and affected nail areas (R-TF-028-004 Data Annotation Instructions - Visual Signs)
Trained annotators labelled images of nails with and without visible lesions following standardized clinical annotation protocols. Annotations consisted of drawing segmentation masks (polygons) covering the nail plate and each affected nail area.
Dataset statistics:
The dataset is split at patient level to avoid data leakage. The training, validation, and test sets contain images from different patients.
- Images of healthy nails: 634
- Images of nails with visible lesions: 1845
- Training set: 1787 images
- Validation set: 326 images
- Test set: 366 images
- Total images: 2479
Training Methodology
The best segmentation backbone and architecture were determined after a thorough exploration of the existing approaches suitable for the task at hand:
- Backbones: EfficientNet, MobileNet, Resnet
- Architecture: UNet, UNet++, FPN
Architecture: UNet segmentation network with a ResNet101 backbone
- Deep learning model tailored for multi-class image segmentation (background, nail plate, nail lesion)
- Transfer learning from pre-trained weights (ImageNet dataset)
- Input size: 480x480 pixels
Training approach:
The model has been trained using the following hyperparameters:
- Optimizer: AdamW with learning rate 0.0001
- Batch size: 16
- Training duration: 40 epochs
Pre-processing:
- In the training stage, input images were cropped and/or resized to 480x480 pixels when needed. In the validation and test stage, the inputs were directly resized to 480x480 pixels.
- Data augmentation: geometric, color, and light augmentations.
Post-processing:
- Confidence threshold of 0.5 for each channel of the output mask to generate positive and negative pixel-level predictions for each class (background, nail plate, nail lesion).
Performance Results
Performance is evaluated using Intersection over Union (IoU), also called the Jaccard index. The IoU is computed for nail plate and nail lesion classes. Statistics are calculated with 95% confidence intervals using bootstrapping (1000 samples). Success criteria are defined as IoU ≥ 0.70 for overall nail plate and IoU ≥ 0.70 for nail lesion.
| Metric | Result | Success Criterion | Outcome |
|---|---|---|---|
| IoU (overall nail segmentation) | 0.8900 (95% CI: [0.8712-0.9061]) | ≥ 0.80 | PASS |
| IoU (nail lesion segmentation) | 0.8195 (95% CI: [0.7934-0.8418]) | ≥ 0.70 | PASS |
Verification and Validation Protocol
Test Design:
- Compare predicted and ground truth segmentation masks of nail plates and nail lesions
- Evaluation across diverse skin tones
Complete Test Protocol:
- Input: RGB images from test set with nail plate and lesion annotations from trained professionals
- Processing: Semantic segmentation inference
- Output: Predicted binary probabilities for each class (nail plate and nail lesion) converted to binary outputs (0/1) using a confidence threshold of 0.50.
- Ground truth: Expert-annotated segmentation masks
- Statistical analysis: IoU (nail plate and nail lesion)
Data Analysis Methods:
- IoU of nail plate and nail lesion masks with a confidence threshold of 0.50
Test Conclusions:
- The model met all success criteria, demonstrating reliable segmentation of the nail plate and affected nail areas.
- The model showed robustness across different skin tones and severities, indicating generalizability.
Bias Analysis and Fairness Evaluation
Objective: Ensure nail segmentation performs consistently across demographic subpopulations.
Subpopulation Analysis Protocol:
- Performance stratified by Fitzpatrick skin types: I-II (light), III-IV (medium), V-VI (dark)
- Success criterion: IoU ≥ 0.80 for overall nail segmentation and Iou ≥ 0.70 for lesion segmentation, for all Fitzpatrick types.
| Fitzpatrick Skin Type | No. images | IoU (overall nail segmentation) | IoU (nail lesion segmentation) |
|---|---|---|---|
| I-II | 238 | 0.8787 (95% CI: [0.8568, 0.8997]) | 0.8193 (95% CI: [0.7871, 0.8494]) |
| III-IV | 73 | 0.9045 (95% CI: [0.8665, 0.9366]) | 0.8331 (95% CI: [0.7708, 0.8873]) |
| V-VI | 55 | 0.9214 (95% CI: [0.9012, 0.9392]) | 0.8017 (95% CI: [0.7280, 0.8710]) |
Results Summary:
- All Fitzpatrick skin types met the IoU success criteria.
- The model performs consistently across different skin tones, indicating effective generalization.
- Future data collection should prioritize expanding the dataset for underrepresented skin types to reduce confidence interval variability and improve overall model robustness.
Bias Mitigation Strategies:
- Image augmentation including color and lighting variations during training
- Pre-training on diverse data to improve generalization
Bias Analysis Conclusion:
- The model demonstrated consistent performance across Fitzpatrick skin types, with most success criteria met.
Hypopigmentation or Depigmentation Surface Quantification
Model Overview
Reference: R-TF-028-001 AI/ML Description - Hypopigmentation or Depigmentation Surface Quantification section
This model segments hypopigmented or depigmented areas for vitiligo extent assessment and repigmentation tracking.
Clinical Significance: Depigmentation area is essential for assessing disease severity.
Data Requirements and Annotation
Model-specific annotation: Polygon annotations for affected areas (R-TF-028-004 Data Annotation Instructions - Visual Signs)
Model-specific annotation: Extent Annotation (R-TF-028-024 Data Annotation Instructions - Non-clinical Data)
Medical experts traced precise boundaries of affected skin:
- Polygon tool for accurate edge delineation
- Separate polygons for non-contiguous patches
- High spatial precision for reliable area calculation
- Multi-annotator consensus for boundary agreement
Dataset statistics:
- Images with hypopigmentation segmentation annotations: 970 images
- Training set: 90% of the hypopigmentation images plus 10% of healthy skin images
- Validation set: 10% of the hypopigmentation images
- Test set: 10% of the hypopigmentation images
- Categories: Vitiligo and other hypopigmentation disorders
Training Methodology
Architecture: EfficientNet-B4, a convolutional neural network optimized for image classification tasks with a final layer adapted for a binary output.
- Transfer learning from pre-trained weights (ImageNet)
- Input size: RGB images at 512 pixels resolution
Other architectures and resolutions were evaluated during model selection, with EfficientNet-B4 at 512x512 pixels providing the best balance of performance and computational efficiency. EfficientNet-B4 was selected over smaller variants (B2, B3) because hypopigmentation segmentation requires detection of subtle color variations that can be challenging to distinguish from normal skin tone variations, particularly across different Fitzpatrick skin types. The increased model capacity of B4 was necessary to capture these fine-grained pigmentation differences and ensure robust performance across diverse skin tones. Lower resolutions led to loss of detail, while higher resolutions increased computational cost without significant performance gains. Vision Transformer architectures were also evaluated, showing lower performance likely due to the limited dataset size for this specific task.
Training approach:
- Pre-processing: Normalization of input images to standard mean and std of the ImageNet dataset. Other normalizations were evaluated during model selection, with ImageNet normalization providing the best performance.
- Data augmentation: Rotations, mirroring, color jittering, cropping, zoom-out, brightness/contrast adjustments, blur. The global color changes introduced by some augmentations (e.g., color jittering, brightness/contrast adjustments) were carefully tuned to avoid altering the visual appearance. A global augmentation intensity was evaluated to reduce overfitting while preserving the clinical sign characteristics and model performance.
- Data sampler: Batch size 64, with balanced sampling to ensure uniform class distribution across intensity levels. Larger and smaller batch sizes were evaluated during model selection, with non-significant performance differences observed.
- Class imbalance handling: Balanced sampling strategy to ensure uniform class distribution. Other strategies were evaluated during model selection (e.g., focal loss, weighted cross-entropy loss), with balanced sampling providing the best performance.
- Backbone architecture: A DeepLabV3+ segmentation head was added on top of the EfficientNet-B4 backbone to perform pixel-wise segmentation. Other segmentation heads were evaluated during model selection (e.g., U-Net, FCN), with DeepLabV3+ providing the best performance likely due to its atrous spatial pyramid pooling module that captures multi-scale context.
- Loss function: Combined Cross-entropy loss with logits and Jaccard loss. Associated weights were set based on a hyperparameter search. Weighted cross-entropy loss was evaluated during model selection, with no significant performance differences observed, as the balanced sampling strategy provided sufficient class balance to avoid the need for weighted loss.
- Optimizer: AdamW with learning rate 0.001, betas (0.9, 0.999), weight decay 0. SGD and RMSProp optimizers were evaluated during model selection, with Adam providing the best convergence speed and final performance, likely due to the dataset size and complexity.
- Training duration: 400 epochs. At this point, the model had fully converged with evaluation metrics on the validation set stabilizing.
- Learning rate scheduler: StepLR with step size 1 epoch, and gamma to decay the learning rate to 1.e-2 the starting learning rate at the end of training. Other schedulers were evaluated during model selection (e.g., cosine annealing, ReduceLROnPlateau), with no significant performance differences observed.
- Evaluation metrics: IoU, F1-score, accuracy, sensitivity, and specificity calculated on the validation set after each epoch to monitor training progress and select the best model based on validation IoU.
- Model freezing: No freezing of layers was applied. Freezing strategies were evaluated during model selection, showing a negative impact on performance likely due to the domain gap between ImageNet and dermatology images.
Post-processing:
- Sigmoid activation to obtain probability distributions
- Binary classification thresholds to convert probabilities to binary masks.
Performance Results
Performance evaluated using IoU compared to expert consensus.
Success criterion: IoU > 69% (performance based on scientific literature and expert consensus considering inter-observer variability in hypopigmentation segmentation tasks).
| Metric | Result: Mean (95% CI) | # samples | Success Criterion | Outcome |
|---|---|---|---|---|
| Model IoU | 0.712 (0.685, 0.737) | 194 | ≥ 0.69 | PASS |
Verification and Validation Protocol
Test Design:
- Independent test set with multi-annotator reference standard (minimum 3 dermatologists per image)
- Comparison against expert consensus (mean of expert scores) rounded to nearest integer
- Evaluation across diverse Fitzpatrick skin types and severity levels
Complete Test Protocol:
- Input: RGB images from test set with expert hypopigmentation segmentation annotations
- Processing: Model inference with segmentation output
- Output: Predicted hypopigmentation segmentation masks
- Reference standard: Consensus segmentation masks from multiple expert dermatologists
- Statistical analysis: IoU, Accuracy, F1-score, with Confidence Intervals calculated using bootstrap resampling (2000 iterations).
- Robustness checks were performed to ensure consistent performance across several image transformations that do not alter the clinical sign appearance and simulate real-world variations (rotations, brightness/contrast adjustments, zoom, and image quality).
Data Analysis Methods:
- IoU calculation with Confidence Intervals: Intersection over Union comparing model segmentation predictions to expert consensus masks
- Inter-observer variability measurement
- Bootstrap resampling (2000 iterations) for 95% confidence intervals
Test Conclusions:
Model performance met the predefined success criterion with an overall IoU of 0.712 (95% CI: 0.685, 0.737) on the test set of 194 samples. The model demonstrated robust segmentation capabilities across diverse skin types and hypopigmentation presentations, indicating its suitability for clinical application in hypopigmentation surface quantification.
Image example of the model output:
To visualize the model's segmentation performance, below is an example image showcasing the hypopigmentation segmentation output:
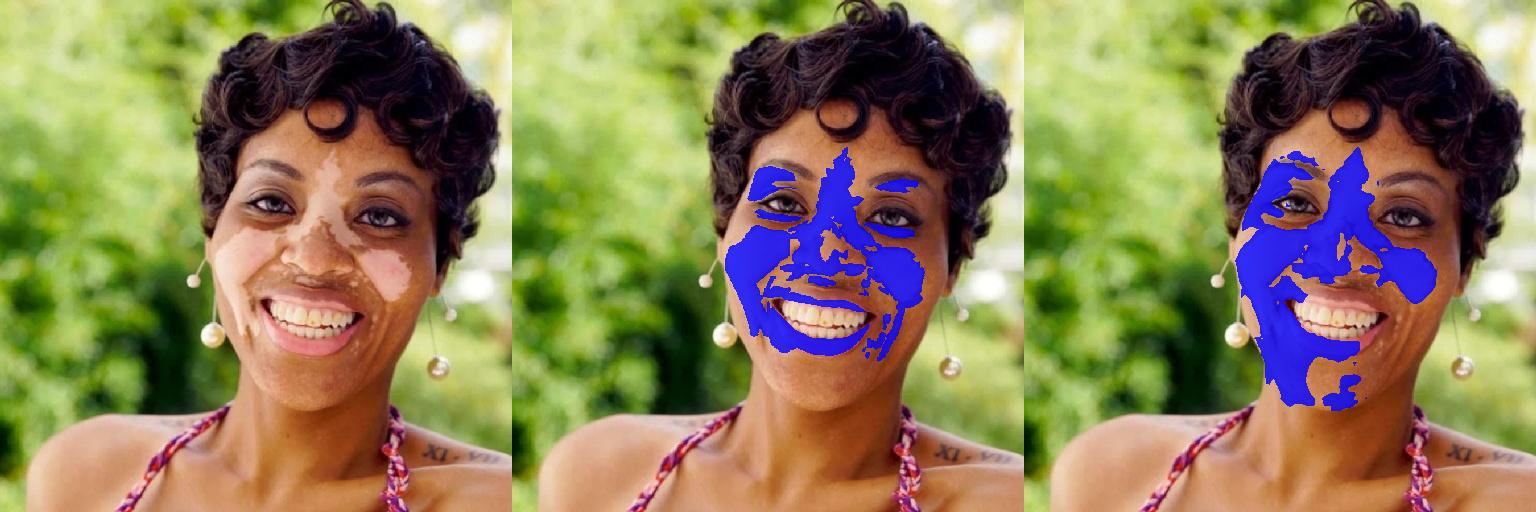
Bias Analysis and Fairness Evaluation
Objective: Ensure hypopigmentation surface quantification performs consistently across demographic subpopulations, with special attention to Fitzpatrick skin types.
Subpopulation Analysis Protocol:
1. Fitzpatrick Skin Type Analysis:
- RMAE calculation per Fitzpatrick type (I-II, III-IV, V-VI)
- Comparison of model performance vs. expert inter-observer variability per skin type
Bias Mitigation Strategies:
- Training data balanced across Fitzpatrick types
Results Summary:
| Metric | Result: Mean (95% CI) | # samples | Success Criterion | Outcome |
|---|---|---|---|---|
| IOU Fitzpatrick I-II | 0.69 (0.63, 0.74) | 64 | ≥ 0.69 (0.56, 0.79) | PASS |
| IOU Fitzpatrick III-IV | 0.72 (0.68, 0.76) | 93 | ≥ 0.69 (0.56, 0.79) | PASS |
| IOU Fitzpatrick V-VI | 0.74 (0.69, 0.779) | 37 | ≥ 0.69 (0.56, 0.79) | PASS |
Bias Analysis Conclusion:
The model's performance, assessed using the Intersection over Union (IOU) metric across all available Fitzpatrick scale categories, successfully meets the predefined Success Criterion established by annotator variability. For the Fitzpatrick I-II group, the model achieved a mean IOU of 0.69 with a 95% Confidence Interval (CI) of (0.63, 0.74). Crucially, the lower bound of the model's 95% CI (0.63) is comfortably above the lower bound of the annotator's CI (0.56), satisfying the PASS criterion. Furthermore, the model's mean IOU (0.69) meets the Success Criterion (0.69). The performance is even stronger for the Fitzpatrick III-IV group, yielding a mean IOU of 0.72 (95% CI: 0.68, 0.76). Here, the lower bound of the model's CI (0.68) significantly exceeds the lower bound of the annotator's CI (0.56), and the model's mean IOU (0.72) also substantially surpasses the Success Criterion (0.69). The trend continues with the Fitzpatrick V-VI group, which showed the highest mean IOU of 0.74 (95% CI: 0.69, 0.779). For this category, the lower bound of the model's CI (0.69) not only meets the Success Criterion but is also well above the lower bound of the annotator's CI (0.56), while the model's mean IOU (0.74) also exceeds the Success Criterion (0.69). Overall, the model demonstrates consistently high segmentation agreement with a mean IOU that meets or exceeds the expert agreement criterion across all Fitzpatrick scale categories, strongly indicating minimal segmentation quality bias.
Hyperpigmentation Surface Quantification
Model Overview
Reference: R-TF-028-001 AI/ML Description - Hyperpigmentation Surface Quantification section
This model segments hyperpigmented areas.
Clinical Significance: Hyperpigmentation area quantification aids in severity assessment and treatment monitoring.
Data Requirements and Annotation
Model-specific annotation: The ISIC 2018 Task1 Challenge dataset annotations were used for hyperpigmentation segmentation. Images on the ISIC dataset containing hyperpigmented lesions were selected, and polygon annotations corresponding to hyperpigmented areas were converted into binary masks representing affected skin.
Dataset statistics:
- Images with hyperpigmentation segmentation annotations: 3700 images
- Training set: 90% of the hyperpigmentation images plus 10% of healthy skin images
- Validation set: 10% of the hyperpigmentation images
- Test set: 10% of the hyperpigmentation images
- Categories: Various pigmentation disorders
Training Methodology
Architecture: EfficientNet-B4, a convolutional neural network optimized for image classification tasks with a final layer adapted for a binary output.
- Transfer learning from pre-trained weights (ImageNet)
- Input size: RGB images at 512 pixels resolution
Other architectures and resolutions were evaluated during model selection, with EfficientNet-B4 at 512x512 pixels providing the best balance of performance and computational efficiency. EfficientNet-B4 was selected over smaller variants (B2, B3) because hyperpigmentation segmentation requires detection of subtle color variations that can be challenging to distinguish from normal skin tone variations, particularly across different Fitzpatrick skin types. The increased model capacity of B4 was necessary to capture these fine-grained pigmentation differences and ensure robust performance across diverse skin tones. Lower resolutions led to loss of detail, while higher resolutions increased computational cost without significant performance gains. Vision Transformer architectures were also evaluated, showing lower performance likely due to the limited dataset size for this specific task.
Training approach:
- Pre-processing: Normalization of input images to standard mean and std of the ImageNet dataset. Other normalizations were evaluated during model selection, with ImageNet normalization providing the best performance.
- Data augmentation: Rotations, mirroring, color jittering, cropping, zoom-out, brightness/contrast adjustments, blur. The global color changes introduced by some augmentations (e.g., color jittering, brightness/contrast adjustments) were carefully tuned to avoid altering the visual appearance. A global augmentation intensity was evaluated to reduce overfitting while preserving the clinical sign characteristics and model performance.
- Data sampler: Batch size 64, with balanced sampling to ensure uniform class distribution across intensity levels. Larger and smaller batch sizes were evaluated during model selection, with non-significant performance differences observed.
- Class imbalance handling: Balanced sampling strategy to ensure uniform class distribution. Other strategies were evaluated during model selection (e.g., focal loss, weighted cross-entropy loss), with balanced sampling providing the best performance.
- Backbone architecture: A DeepLabV3+ segmentation head was added on top of the EfficientNet-B4 backbone to perform pixel-wise segmentation. Other segmentation heads were evaluated during model selection (e.g., U-Net, FCN), with DeepLabV3+ providing the best performance likely due to its atrous spatial pyramid pooling module that captures multi-scale context.
- Loss function: Combined Cross-entropy loss with logits and Jaccard loss. Associated weights were set based on a hyperparameter search. Weighted cross-entropy loss was evaluated during model selection, with no significant performance differences observed, as the balanced sampling strategy provided sufficient class balance to avoid the need for weighted loss.
- Optimizer: AdamW with learning rate 0.001, betas (0.9, 0.999), weight decay 0. SGD and RMSProp optimizers were evaluated during model selection, with Adam providing the best convergence speed and final performance, likely due to the dataset size and complexity.
- Training duration: 400 epochs. At this point, the model had fully converged with evaluation metrics on the validation set stabilizing.
- Learning rate scheduler: StepLR with step size 1 epoch, and gamma to decay the learning rate to 1.e-2 the starting learning rate at the end of training. Other schedulers were evaluated during model selection (e.g., cosine annealing, ReduceLROnPlateau), with no significant performance differences observed.
- Evaluation metrics: IoU, F1-score, accuracy, sensitivity, and specificity calculated on the validation set after each epoch to monitor training progress and select the best model based on validation IoU.
- Model freezing: No freezing of layers was applied. Freezing strategies were evaluated during model selection, showing a negative impact on performance likely due to the domain gap between ImageNet and dermatology images.
Post-processing:
- Sigmoid activation to obtain probability distributions
- Binary classification thresholds to convert probabilities to binary masks.
Performance Results
Performance evaluated using Intersection over Union (IoU) compared to expert consensus.
Success criterion: IoU ≥ 0.82 (performance based on expert inter-observer agreement)
| Metric | Result: Mean (95% CI) | # samples | Success Criterion | Outcome |
|---|---|---|---|---|
| Model IoU | 0.825 (0.809, 0.838) | 370 | ≥ 0.82 (0.79, 0.88) | PASS |
Verification and Validation Protocol
Test Design:
Model-specific annotation: Intensity annotation (R-TF-028-004 Data Annotation Instructions - Visual Signs)
- Independent test set with multi-annotator reference standard (minimum 3 dermatologists per image)
- Comparison against expert consensus (mean of expert scores) rounded to nearest integer
- Evaluation across diverse Fitzpatrick skin types and severity levels
Complete Test Protocol:
- Input: RGB images from test set with expert hyperpigmentation segmentation annotations
- Processing: Model inference with segmentation output
- Output: Predicted hyperpigmentation segmentation masks
- Reference standard: Consensus segmentation masks from multiple expert dermatologists
- Statistical analysis: IoU, Accuracy, F1-score, with Confidence Intervals calculated using bootstrap resampling (2000 iterations).
- Robustness checks were performed to ensure consistent performance across several image transformations that do not alter the clinical sign appearance and simulate real-world variations (rotations, brightness/contrast adjustments, zoom, and image quality).
Data Analysis Methods:
- IoU calculation with Confidence Intervals: Intersection over Union comparing model segmentation predictions to expert consensus masks
- Inter-observer variability measurement
- Bootstrap resampling (2000 iterations) for 95% confidence intervals
Test Conclusions:
Model performance met the predefined success criterion with an overall IoU of 0.825 (95% CI: 0.809, 0.838) on the test set of 370 samples. The model demonstrated robust segmentation capabilities across diverse skin types and hyperpigmentation presentations, indicating its suitability for clinical application in hyperpigmentation surface quantification.
Image example of the model output:
To visualize the model's segmentation performance, below is an example image showcasing the hyperpigmentation segmentation output:
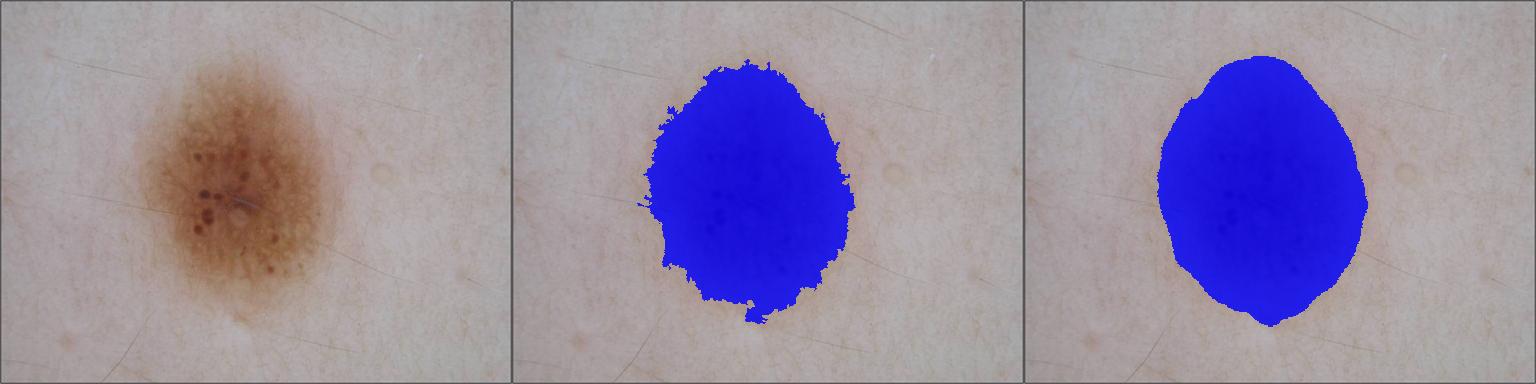
Bias Analysis and Fairness Evaluation
Objective: Ensure hyperpigmentation surface quantification performs consistently across demographic subpopulations, with special attention to Fitzpatrick skin types.
Subpopulation Analysis Protocol:
1. Fitzpatrick Skin Type Analysis:
- IoU calculation per Fitzpatrick type (I-II, III-IV, V-VI)
- Comparison of model performance vs. expert inter-observer variability per skin type
Bias Mitigation Strategies:
- Training data balanced across Fitzpatrick types
Results Summary:
| Metric | Result: Mean (95% CI) | # samples | Success Criterion | Outcome |
|---|---|---|---|---|
| IoU Fitzpatrick I-II | 0.822 (0.806, 0.837) | 352 | ≥ 0.82 (0.79, 0.88) | PASS |
| IoU Fitzpatrick III-IV | 0.885 (0.85, 0.917) | 18 | ≥ 0.82 (0.79, 0.88) | PASS |
| IoU Fitzpatrick V-VI | N/A | 0 | N/A | N/A |
Bias Analysis Conclusion:
The model's performance, assessed using the Intersection over Union (IOU) metric, demonstrates a successful and robust classification capability across the available Fitzpatrick scale categories, exceeding the predefined Success Criterion established by annotator variability. For the Fitzpatrick I-II group, the model achieved a mean IOU of 0.822 with a 95% Confidence Interval (CI) of (0.806, 0.837). Crucially, the lower bound of the model's 95% CI (0.806) is above the lower bound of the annotator's CI (0.79), indicating that the model's segmentation agreement is consistently within the range of expert agreement. Furthermore, the model's mean IOU (0.822) meets the Success Criterion (0.82), confirming performance on par with expert human segmentation agreement. Even more impressively, the Fitzpatrick III-IV group, despite a smaller sample size, yielded a stronger model mean IOU of 0.885 (95% CI: 0.85, 0.917). For this group, the entire model's 95% CI (0.85, 0.917) is substantially above the lower bound of the annotator's CI (0.79), and the model's mean IOU (0.885) significantly exceeds the Success Criterion (0.82). This successful performance across both available groups suggests the model exhibits a high level of agreement and minimal bias with respect to segmentation quality across different Fitzpatrick scale categories. The analysis for the Fitzpatrick V-VI group is currently precluded due to a lack of samples.
Skin Surface Segmentation
Model Overview
Reference: R-TF-028-001 AI/ML Description - Skin Surface Segmentation section
This model segments skin regions to distinguish skin (including lesions, lips, shallow hair, etc.) from non-skin areas (including clothing, background, dense hair, etc.).
Clinical Significance: Accurate skin segmentation is a prerequisite for calculating lesion percentages relative to visible skin area.
Data Requirements and Annotation
Compiled dataset: 50366 images divided into two sets:
clinical-set, composed of 18034 clinical and dermatoscopic images sourced from theICD-11dataset to cover a diverse range of clinical presentations, body parts, and skin tones.non-clinical-set, composed of 32332 non-dermatology-related images sourced from theDescribable Texture Dataset,HGR,Schmugge,SFA,FSD,TexturePatch,abdominal,fashionpediaandhumanparsingdatasets.
Model-specific annotation: Extent Annotation (R-TF-028-024 Data Annotation Instructions - Non-clinical Data)
- Images are annotated with a binary mask where 1 represents skin and 0 represents non-skin regions.
- Skin regions include healthy skin, lips, ears, nails, tattoos, skin lesions, low hair density areas where skin is visible (excluding scalp hair), skin visible through transparent glass lenses, watermarks placed over skin, skin from multiple persons, and marks or circles painted or drawn over the skin.
- Non-skin regions include background pixels, clothes, jewellery, glasses, eyes, teeth, eyebrows, scalp, dense hair (head hair, dense beards, etc.), medical material or instruments (forceps, gauze, plasters, etc.), surgical gloves, anonymisation bands, watermarks (if over non-skin), and dermatoscope shadow.
- The
clinical-setcontains both clinical and dermatoscopic images. - The
non-clinical-setcontains non-dermatology related images. - The
clinical-setis annotated by trained personnel with the above specifications. Each image is annotated by a single annotator. - Annotations for the
non-clinical-setare sourced from their original authors. Original mask annotations are cleaned and standardized to match the above specifications. This standardization includes refining the lip, eyes, teeth, eyebrows, and nose holes. Images with minimal skin coverage were not included in this set.
Dataset statistics:
The dataset is split in train and validation sets. The dataset is split at patient level to avoid data leakage when subject information is available.
- Images: 50366
- Train and validation sets contain 41074 and 9292 images respectively.
- Images can be clinical, dermatoscopic, or non-clinical and span a broad range of clinical presentations, body parts, and skin tones.
Training Methodology
The model architecture and training hyperparameters were selected after a systematic hyperparameter tuning process. We compared different image encoders (e.g., ConvNext and EfficientNet of different sizes), decoders (e.g., UNet, UNet++, and FPN), and evaluated multiple data hyperparameters (e.g., input resolutions, augmentation strategies) and optimization configurations (e.g., batch size, learning rate). The final configuration was chosen as the best trade-off between performance and runtime efficiency.
Architecture:
The model is a binary semantic segmentation network designed to distinguish skin regions from non-skin areas. It uses an encoder-decoder architecture with skip connections.
- Encoder (Backbone):
- Model: EfficientNet-B1 (
timm-efficientnet-b1) - Pre-training: ImageNet weights
- Model: EfficientNet-B1 (
- Decoder:
- UNet++ decoder architecture with nested skip pathways
- Progressively upsamples encoder features to reconstruct segmentation masks
- Dense skip connections enable multi-scale feature fusion
- Segmentation Head:
- Final layer producing pixel-wise predictions
- Output: Single-channel binary mask (1 class)
- Predicts probability of each pixel being skin vs. non-skin
- Input/Output Specifications:
- Input channels: 3 (RGB images)
- Output channels: 1 (binary segmentation)
- Input size: 384×384 pixels
The model is implemented with PyTorch and the segmentation_models_pytorch (SMP) library.
Training approach:
The training process employs a three-stage progressive training strategy, starting with a frozen encoder backbone, followed by full model fine-tuning, and concluding with a focused last phase using a refined dataset. The approach incorporates weighted dataset sampling, data augmentation, and mixed-precision training.
- Training Stages:
- Stage 1 (Frozen Encoder): Trains only the decoder and segmentation head for 14 epochs while keeping the encoder frozen.
- Stage 2 (Full Fine-tuning): Unfreezes the entire model and trains for 30 epochs with differential learning rates (encoder uses linear decay from base LR to 1×10⁻⁸).
- Stage 3 (Last Phase Refinement): Continues training for 40 additional epochs using a refined dataset composition which excluded the datasets that likely introduce noise into the training process.
- Training imges are sampled with a weighted strategy to ensure a balanced representation of the clinical images in the learning process.
- Data Filtering: Excludes images with minimal skin coverage, images with more than 1 detected person, and manually identified mislabeled samples.
- Optimization:
- Optimizer: AdamW Schedule-Free with weight decay (0.001)
- Learning Rate: 0.005 with 3-epoch warmup (converted to step-based warmup)
- Differential Learning Rates: Encoder uses linear decay to 1×10⁻⁸; decoder and segmentation head maintain base learning rate
- Gradient Clipping: Gradients clipped to norm of 0.5
- Batch Size: 64
- Mixed Precision: Enabled using automatic mixed precision (AMP)
- Loss Function:
- Combined Dice Loss and Binary Cross-Entropy (BCE)
- Optimizes pixel-wise segmentation accuracy and boundary delineation
Data Pre-processing and Augmentation:
- Geometric Transformations: random shift, scale, and rotation, random resized crop, zoom-out augmentation, horizontal flip.
- Light, saturation, contrast, and color augmentations.
- Image Normalization
- Image Resizing: Longest side resized to 384 pixels, then padded to 384×384 square with constant padding
- Batch Size: 64 images per batch
Validation images receive only resizing, padding, and normalization without augmentation.
Post-processing:
- Segmentation masks are generated by thresholding the model's output probabilities
- Binary predictions: pixels with probability ≥0.5 classified as skin, otherwise as non-skin
Performance Results
Performance is evaluated using Intersection over Union (IoU) and the F1-score compared to expert-annotated reference standard skin masks. Success criteria is set as the average performance of SOTA models.
| Metric | Result | Success Criterion | Outcome |
|---|---|---|---|
| IoU | 0.97 (0.97-0.97) | ≥ 0.83 | PASS |
| F1-score | 0.98 (0.98-0.98) | ≥ 0.84 | PASS |
Verification and Validation Protocol
Test Design:
- 4515 clinical images from the validation split of the
clinical-setdataset which contains reliable mask annotations. - Images are annotated by trained personnel.
- These images represent diverse clinical presentations, anatomical sites, lighting conditions, and skin tone spectrums.
Complete Test Protocol:
- Input: Images of skin.
- Pre-processing: Image resizing to 384x384 pixels and normalization.
- Processing: Skin segmentation model inference.
- Output: Predicted binary mask with confidence scores.
- Reference standard: Expert-annotated binary mask.
- Statistical analysis: IoU and F1-score.
Data Analysis Methods:
- IoU.
- F1-score.
- Binary mask visualization.
Test Conclusions:
- The model met all success criteria, demonstrating reliable skin segmentation.
- The model demonstrates non-inferiority with respect to SOTA models.
- The model's performance is within acceptable limits.
- The model showed robustness across different imaging conditions, indicating generalizability.
Bias Analysis and Fairness Evaluation
Objective: Validation ensures accurate identification across the full Fitzpatrick spectrum.
Subpopulation Analysis Protocol:
1. Fitzpatrick Skin Tone Analysis:
- Performance stratified by Fitzpatrick skin tones: I-II (light), III-IV (medium), V-VI (dark).
- Metrics evaluated: IoU and F1-score.
- Fitzpatrick success criteria: IoU ≥ 0.83; F1-score ≥ 0.84.
| Subpopulation | Num. training images | Num. validation images | IoU | F1-score | Outcome |
|---|---|---|---|---|---|
| Fitzpatrick I-II | 21228 | 1849 | 0.96 (0.96-0.97) | 0.98 (0.98-0.98) | PASS |
| Fitzpatrick III-IV | 13979 | 1798 | 0.98 (0.97-0.98) | 0.99 (0.99-0.99) | PASS |
| Fitzpatrick V-VI | 5867 | 868 | 0.97 (0.96-0.97) | 0.98 (0.98-0.98) | PASS |
Results Summary:
- The model met all success criteria, demonstrating reliable skin surface segmentation.
- The model presents consistent robustness across all skin tone subpopulations.
- The model demonstrates non-inferiority with respect to SOTA models.
- The model's performance is within acceptable limits.
Bias Mitigation Strategies:
- Image augmentation including geometric, contrast, saturation, and color augmentations.
- Weighted dataset sampling to ensure balanced representation of image conditions in the learning process.
- Pre-training on diverse data to improve generalization.
- Three-stage progressive training strategy to adapt the pre-trained encoder to the segmentation task.
Bias Analysis Conclusion:
- The model demonstrated consistent performance across different subpopulations.
- The model met all success criteria, demonstrating reliable skin surface segmentation.
Follicular and Inflammatory Pattern Identification
Model Overview
Reference: R-TF-028-001 AI/ML Description - Follicular and Inflammatory Pattern Identification section
This model identifies three hidradenitis suppurativa (HS) patterns corresponding to the three phenotypes defined by the Martorell classification system (follicular, inflammatory, mixed).
Clinical Significance: Essential for diagnosing and characterizing follicular and inflammatory dermatoses and differentiating HS phenotypes.
Data Requirements and Annotation
Foundational annotation: ICD-11 mapping annotations were used to find 1259 images of hidradenitis suppurativa and 504 images of clear skin with no visible HS phenotype patterns.
Model-specific annotation: Each image was categorized as either one of the three possible HS phenotypes or the "no phenotype" supporting class. The annotation procedure for ordinal and categorical classification tasks is defined in R-TF-028-004 Data Annotation Instructions - Visual Signs.
Dataset statistics:
The dataset is split at patient level to avoid data leakage. The training, validation, and test sets contain images from different patients.
- Images of follicular phenotype: 271
- Images of inflammatory phenotype: 504
- Images of mixed phenotype: 484
- Images of clear skin: 504
- Training set: 1248 images
- Validation set: 257 images
- Test set: 258 images
- Total images: 1763
Training Methodology
The best segmentation backbone and architecture were determined after a thorough evaluation of several backbones suitable for the task at hand: EfficientNet, MobileNet, Resnet, ConvNext
Architecture: ConvNext V2 (base size)
- Deep learning model tailored for multi-class classification (follicular, mixed, inflammatory)
- Transfer learning from pre-trained weights (ImageNet dataset)
- Input size: 384x384 pixels
Given the complexity of the "Mixed" phenotype class, which includes both "Follicular" and "Inflammatory" patterns, the model was built for 2-class multi-label classification: it predicts whether follicular and/or inflammatory patterns are present or absent in the image. The probabilities are converted to binary outputs (1, positive or present; 0, negative or absent) using a probability threshold (). A given pattern will be considered to be present if its corresponding probability is greater than or equal to the threshold .
Based on these predicted binary outputs, the final class can be derived:
- [0, 0] --> No phenotype visible
- [1, 0] --> Follicular pattern
- [0, 1] --> Inflammatory pattern
- [1, 1] --> Mixed phenotype
Training approach:
The model has been trained using the following hyperparameters:
- Optimizer: AdamW with learning rate 0.0001 and one-cycle learning rate scheduling for faster convergence
- Batch size: 32
- Training duration: 40 epochs
Pre-processing:
- In the training stage, input images were resized to 384x384 pixels via random cropping and resizing. In the validation and test stage, the inputs were directly resized to 384x384 pixels.
- Data augmentation: geometric, color, and light augmentations.
Performance Results
Performance is evaluated using Balanced Accuracy (BACC) and average F1 score. Statistics are calculated with 95% confidence intervals using bootstrapping (1000 samples). Success criteria are defined as BACC ≥ 0.65 and F1 ≥ 0.65. A threshold search was conducted on the validation set to obtain the best value, and the following test results are obtained using that threshold (0.60).
| Metric | Result | Success Criterion | Outcome |
|---|---|---|---|
| BACC | 0.6837 (95% CI: [0.6287-0.7398]) | ≥ 0.65 | PASS |
| Average F1 score | 0.6976 (95% CI: [0.6457-0.7526]) | ≥ 0.65 | PASS |
Verification and Validation Protocol
Test Design:
- Compare predicted and ground truth labels on a separate, unseen set of images.
- Use a binary threshold derived from a threshold search on the validation data.
- Evaluation across diverse skin tones
Complete Test Protocol:
- Input: RGB images of HS and skin with no visible lesions, annotated by trained professionals
- Processing: Multi-label classification inference
- Output: Predicted binary probabilities for each pattern (follicular and inflammatory) converted to binary outputs (0/1) using a confidence threshold of 0.60 (optimized via threshold search on validation set), and finally converted to a multi-class classification output (4 classes: no phenotype, follicular, inflammatory, mixed).
- Ground truth: Expert-annotated labels
- Statistical analysis: Balanced accuracy and average F1 score
Data Analysis Methods:
- Balanced accuracy and average F1 score
Test Conclusions:
- The model met all success criteria, demonstrating reliable identification of HS patterns according to the Martorell phenotypes.
- The model showed robustness across different skin tones and severities, indicating generalizability.
Bias Analysis and Fairness Evaluation
Objective: Ensure phenotype identification works consistently across demographic subpopulations.
Subpopulation Analysis Protocol:
- Performance stratified by Fitzpatrick skin types: I-II (light), III-IV (medium), V-VI (dark)
- Success criterion: Balanced accuracy > 0.65 and average F1 score > 0.65, for all Fitzpatrick skin type groups.
| Skin type | Number of images | Balanced Accuracy | Average F1-score |
|---|---|---|---|
| I-II | 134 | 0.6536 (95% CI: [0.5700-0.7399]) | 0.6632 (95% CI: [0.5836-0.7428]) |
| III-IV | 105 | 0.6954 (95% CI: [0.5971-0.7799]) | 0.6976 (95% CI: [0.6038-0.7787]) |
| V-VI | 19 | 0.6840 (95% CI: [0.5000-1.0000]) | 0.9498 (95% CI: [0.8421-1.0000]) |
Results Summary:
- All Fitzpatrick skin types met the success criteria.
- Despite the current imbalance in skin tone representation, the model performs consistently across skin types, indicating effective generalization.
- Future data collection should prioritize expanding the dataset for underrepresented skin types to reduce confidence interval variability and improve overall model robustness.
Bias Mitigation Strategies:
- Image augmentation including color and lighting variations during training
- Pre-training on diverse data to improve generalization
Bias Analysis Conclusion:
- The model demonstrated consistent performance across Fitzpatrick skin types, with all success criteria met.
Inflammatory Nodular Lesion Pattern Identification
Model Overview
Reference: R-TF-028-001 AI/ML Description - Inflammatory Pattern Identification section
This model identifies the Hurley stage and inflammatory pattern of inflammatory dermatological categories.
Clinical Significance: Inflammatory affection categorization is essential for treatment planning and disease monitoring.
Data Requirements and Annotation
Foundational annotation: ICD-11 mapping, subset of 188 images from Manises-HS
Model-specific annotation: Image Categorization (R-TF-028-004 Data Annotation Instructions - Visual Signs)
A medical expert specialized in inflammatory nodular lesions categorized the images with:
- Hurley Stage Classification: One of four categories, including the three Hurley stages and a
Clearcategory that relates to no inflammatory visual signs. - Inflammatory Activity Classification: One of two categories, inflammatory or non-inflammatory.
Dataset statistics:
The dataset is split at patient level to avoid data leakage. The training and validation sets contain images from different patients.
- Images: 188
- Number of subjects: 188
- Training set: 150 images of which, 148 contain valid Hurley annotations and 136 contain valid inflammatory activity annotations
- Validation set: 38 images of which, 37 contain valid Hurley annotations and 36 contain valid inflammatory activity annotations
Training Methodology
The model architecture and training hyperparameters were selected after a systematic hyperparameter tuning process. We compared different image encoders (e.g., ConvNext and EfficientNet of different sizes) and evaluated multiple data hyperparameters (e.g., input resolutions, augmentation strategies) and optimization configurations (e.g., batch size, learning rate, metric learning). The final configuration was chosen as the best trade-off between performance and runtime efficiency.
Architecture:
The model is a multi-task neural network designed to predict Hurley stages and inflammatory activity simultaneously, while also generating embeddings for metric learning. It uses a shared backbone and common projection head, branching into specific heads for each task.
- Backbone (Encoder):
- Model: ConvNext Small, pre-trained on the ImageNet dataset.
- Regularization: dropout and drop path.
- Common Projection Head:
- A common processing block that maps encoder features to a shared latent space of 256 features.
- Consists of a GELU activation, Dropout, and a Linear layer.
- Task-Specific Heads: The model splits into two distinct branches, one for Hurley and one for Inflammatory Activity. Each branch receives the 256-dimensional output from the Common Projection Head and contains two sub-heads:
- Classification Head:
- A dedicated block (GELU, Dropout, Linear)
- Output size: 4 for Hurley and 2 for Inflammatory Activity.
- Metric Embedding Head:
- A multi-layer perceptron (two sequential blocks of GELU, Dropout, and Linear layers) that outputs feature embeddings.
- Output size: 256 features.
- Classification Head:
- Weight Initialization:
- Linear Layers: Xavier Normal initialization.
- Biases: Initialized to zero.
The model is implemented with PyTorch and the Python timm library.
Training approach:
The training process employs a multi-task learning strategy, optimizing for both classification accuracy and embedding quality. It utilizes a two-stage approach, starting with a frozen backbone followed by full model fine-tuning. It also incorporates data augmentation and mixed-precision training.
- Training Stages:
- Stage 1 (Frozen Backbone): Trains only the projection and task-specific heads for 15 epochs.
- Stage 2 (Fine-tuning): Trains the entire model for 30 epochs.
- Optimization:
- Optimizer: AdamW Schedule-Free with weight decay (0.01).
- Base LR: 0.0025
- Learning Rate: Includes a 4-epoch warmup. During fine-tuning, the backbone learning rate is scaled down (0.05x) relative to the heads.
- Gradient Clipping: Gradients are clipped to a norm of 0.5.
- Precision: Mixed precision training using BFloat16.
- Loss Functions:
- Classification: Cross-Entropy Loss, weighted to handle class imbalance.
- Metric Learning: NTXentLoss combined with a Batch Easy-Hard Miner (selecting easy positives and hard negatives).
Pre-processing:
- Augmentation: Includes geometric and color transformations.
- Regularization: MixUp is applied to inputs and labels.
- Input: Images are resized to 384x384 with a batch size of 32.
Post-processing:
- Classification probabilities are computed applying the softmax operation over the classification logits.
- Classification categories are selected as the ones with higher probability.
Performance Results
Performance is evaluated using accuracy and Mean Absolute Error (MAE) to account for the correct Hurley stage and accuracy and AUC (ROC) to account for the correct inflammatory activity. Success criteria is set as Accuracy ≥ 40% and MAE ≤ 1 for Hurley staging and accuracy ≥ 70% and AUC (ROC) ≥ 0.70 for inflammatory activity classification.
| Metric | Result | Success Criterion | Outcome |
|---|---|---|---|
| Hurley Stage Accuracy | 0.63 (0.46-0.77) | ≥ 0.40 | PASS |
| Hurley MAE | 0.49 (0.29-0.77) | ≤ 1 | PASS |
| Inflammatory Activity Accuracy | 0.71 (0.57-0.86) | ≥ 0.70 | PASS |
| Inflammatory Activity AUC (ROC) | 0.71 (0.49-0.89) | ≥ 0.70 | PASS |
Verification and Validation Protocol
Test Design:
- Subset of 35 images with both Hurley stage and inflammatory activity annotations.
- Expert-annotator labels.
- Evaluation across diverse skin tones.
Complete Test Protocol:
- Input: RGB images from validation set with expert annotations
- Processing: Image classification inference
- Output: Classification probabilities and predicted categories
- Reference standard: Expert-annotated categories
- Statistical analysis: Accuracy, MAE, AUC (ROC)
Data Analysis Methods:
- Confusion matrix
- Accuracy, AUC (ROC), MAE
Test Conclusions:
- The model's Hurley stage prediction meets all the success criteria, demonstrating reliable performance.
- The model's Hurley stage prediction is within acceptable limits.
- The model's inflammatory activity prediction's mean values meet all the success criteria, demonstrating sufficient performance.
- The model's inflammatory activity prediction's confidence intervals do not meet the success criteria, suggesting the need for further data collection to improve the model learning and evaluation.
Bias Analysis and Fairness Evaluation
Objective: Ensure Hurley stage and inflammatory activity classification performs consistently across demographic subpopulations.
Subpopulation Analysis Protocol:
1. Fitzpatrick Skin Type Analysis:
- Performance stratified by Fitzpatrick skin types: I-II (light), III-IV (medium), V-VI (dark).
- Success criterion: Accuracy ≥ 0.40 and MAE ≤ 1 for Hurley staging; Accuracy ≥ 0.70 and AUC (ROC) ≥ 0.70 for inflammatory activity.
- This evaluation includes 22 synthetic images generated by translating the main evaluation set to Fitzpatrick V–VI skin types using the controlled skin-tone translation pipeline described in
R-TF-028-012 Synthetic Data Generation Protocol. All 22 images were reviewed and accepted by the Medical Director, confirming that inflammatory nodular lesion morphology was preserved. These synthetic images are used exclusively for Fitzpatrick V–VI bias evaluation and are not included in training data.
| Subpopulation | Num. training images | Num. validation images | Hurley Acc | Hurley MAE | Pattern Acc | Pattern AUC (ROC) | Outcome |
|---|---|---|---|---|---|---|---|
| Fitzpatrick I-II | 85 | 20 | 0.60 (0.40-0.80) | 0.54 (0.25-0.90) | 0.70 (0.50-0.90) | 0.72 (0.40-0.93) | PASS |
| Fitzpatrick III-IV | 68 | 15 | 0.67 (0.40-0.87) | 0.40 (0.13-0.67) | 0.74 (0.53-0.93) | 0.71 (0.33-0.96) | PASS |
| Fitzpatrick V-VI | 0 | 22 | 0.45 (0.23-0.64) | 0.82 (0.45-1.23) | 0.77 (0.59-0.95) | 0.72 (0.53-0.90) | PASS |
Results Summary:
- Hurley staging met all the success criteria across Fitzpatrick I-VI levels.
- Hurley staging presents confidence intervals within the acceptable limits. Only the Fitzpatrick V-VI subpopulation presents confidence intervals outside the success criteria.
- Inflammatory activity identification mean values met all the success criteria across Fitzpatrick I-VI levels.
- Inflammatory activity identification confidence intervals exceed the acceptable limits, presumably due to the small number of images in the validation set.
- Future data collection and annotation should prioritize expanding the dataset to ensure a sufficient number of images for all subpopulations, reduce confidence interval variability, and improve model robustness for edge cases.
Bias Mitigation Strategies:
- Image augmentation including color, geometric and MixUp augmentations during training.
- Class-balancing to ensure equal representation of all classes.
- Use of metric learning to improve the model's ability to generalize to new data.
- Pre-training on diverse data to improve generalization
- Two-stage training to fit the model to the new data while benefiting from the image encoder pre-training.
Bias Analysis Conclusion:
- The model demonstrated consistent performance across Fitzpatrick skin types with all success criteria met.
- Inflammatory activity identification and Fitzpatrick V-VI subpopulations presented off-limits confidence intervals, highlighting the need for more data collection for more precise training and validation of the model.
- More data collection is required to validate the model with higher precision, especially for the Fitzpatrick V-VI subpopulations.
Dermatology Image Quality Assessment (DIQA)
Model Overview
Reference: R-TF-028-001 AI/ML Description - DIQA section
This model assesses image quality to filter out images unsuitable for clinical analysis, ensuring reliable downstream model performance.
Clinical Significance: DIQA is critical for patient safety by preventing low-quality images from being analyzed, which could lead to incorrect clinical assessments.
Data Requirements and Annotation
Data Requirements: A dermatology image subset was selected from the main dataset, and was annotated for image quality assessment (IQA), as described in R-TF-028-004 Data Annotation Instructions - Non-clinical data. This IQA-specific dataset was then expanded with other non-clinical image quality assessment datasets: CID2013, TID2013, CID:IQ, LIVE-ItW, NITSIQA, KonIQ-10k, kadid-10k, GFIQA-20k, SPAQ, and BIQ2021.
Dataset statistics:
The dataset has a total size of 85561 images.
-
Images with artificial distortions: 18019
-
Images with real distortions: 67542
-
Non-dermatology images with quality ratings: 69058
-
Dermatology images with quality ratings: 16503
Training Methodology
Architecture: EfficientNet-B0 pretrained on ImageNet. The default classification head was replaced with a regression head specifically designed for this IQA task.
Training approach:
- Score regression: the predicted output is a single scalar value that represents perceived visual quality.
- Loss function: Mean Squared Error (MSE). For a more stable training, the output of the model is compared to the normalized ground truth score.
- Data augmentation: The usual image augmentation methods (e.g. color jittering, rotation, etc.) may break the relationship between the images and their corresponding quality scores, so we used a low-augmentation setting, with only horizontal flips and slight random crops. The goal is to introduce some variability without affecting the image-score relationship.
- Training duration: 30 epochs with learning rate scheduling (cosine annealing).
Performance Results
Success criteria:
- Pearson correlation (PLCC) ≥ 0.70
- Spearman correlation (SROCC) ≥ 0.70
| Metric | Result | Success Criterion | Outcome |
|---|---|---|---|
| Pearson correlation | 0.8959 (95% CI: [0.8910-0.9002]) | ≥ 0.70 | PASS |
| Spearman correlation | 0.9030 (95% CI: [0.8982-0.9071]) | ≥ 0.70 | PASS |
Verification and Validation Protocol
Test Design:
- Test set with expert quality annotations across quality spectrum and acquisition settings
Complete Test Protocol:
- Input: Images with varying quality levels
- Processing: DIQA model inference
- Output: The scalar output is rescaled to the [0, 10] quality score range.
- Ground truth: Mean Opinion Scores (MOS) from annotation specialists
- Statistical analysis: Pearson and Spearman correlation
Data Analysis Methods:
- Pearson and Spearman correlation metrics are computed with confidence intervals using the bootstrapping method.
Test Conclusions:
- The model met all success criteria, demonstrating excellent performance and strong correlation with the quality ratings of a diverse sample of human observers.
Bias Analysis and Fairness Evaluation
To assess model and data bias, we selected the dermatology image subset of the dataset used for DIQA training and evaluated the model's predictions across Fitzpatrick skin types (FST).
Objective: Ensure DIQA performs consistently across populations without unfairly rejecting valid images.
Subpopulation Analysis Protocol:
1. Skin Type Analysis:
- Consistency for different Fitzpatrick skin types
- Ensure darker skin images aren't systematically rated lower quality
Bias Mitigation Strategies:
- Training on diverse imaging conditions and device types
- Balanced dataset across Fitzpatrick types, ensuring all distortions have occurrences on all demographic groups.
Results Summary:
| Fitzpatrick skin type | Num. images | PLCC | SROCC |
|---|---|---|---|
| I-II | 913 | 0.7551 (95% CI: [0.7192-0.7888]) | 0.7640 (95% CI: [0.7310-0.7954]) |
| III-IV | 659 | 0.6884 (95% CI: [0.6435-0.7316]) | 0.7065 (95% CI: [0.6620-0.7500]) |
| V-VI | 182 | 0.4736 (95% CI: [0.3634-0.5811]) | 0.4649 (95% CI: [0.3470-0.5783]) |
Bias Analysis Conclusion: The model shows moderate to strong correlation metrics on darker skin tones, with some bias towards lighter skin tones. A closer inspection of these results revealed that most FST IV-VI images corresponded to bad, poor and fair quality samples, for which the model predicts higher quality scores, hence the lower correlation metrics. The moderate correlation, however, demonstrates that the model is capable of estimating visual quality in such groups.
Domain Validation
Model Overview
Reference: R-TF-028-001 AI/ML Description - Domain Validation section
This model verifies that input images are within the validated domain (dermatological images, including clinical and dermoscopic) vs. non-skin images, preventing clinical models from processing invalid inputs.
Clinical Significance: Critical safety function preventing misuse and ensuring clinical models only analyze appropriate dermatological images.
Data Requirements and Annotation
Data Requirements:
A large subset of the dataset was reviewed and annotated to obtain domain-related labels, as described in R-TF-028-004 Data Annotation Instructions - Non-clinical data. Due to the heterogeneous nature of the dataset, it was possible to obtain labels of all three possible image types (clinical, dermoscopy, non-dermatology). As most images in the dataset are clinical or dermoscopic, the non-dermatology subset was expanded with external open image datasets, to account for as many examples of non-dermatology concepts as possible, such as:
- Paintings, posters, sketches, and screenshots;
- Retinal, MRI, colonoscopy, histology, and ultrasound images;
- Everyday objects, pets, and wildlife.
Dataset statistics: The final curated dataset presented the following distribution:
| Label | No. images |
|---|---|
| Clinical | 588008 |
| Dermoscopy | 125907 |
| Non-dermatology | 163425 |
| Total | 877340 |
Training Methodology
Architecture: EfficientNet-B0
- We used a model pretrained on ImageNet, discarding the original classification head and creating a new one for this three-class classification problem.
- Input size: 224x224x3 pixels (RGB images)
Training approach:
- Multi-class classification (clinical, dermoscopy, non-dermatology image)
- Loss function: Multi-class cross-entropy
- Class balancing: oversample the dermoscopy and non-dermatology images to balance
- Training duration:
- 5 epochs with frozen backbone to train the classification head only
- 5 epochs with the entire model unfrozen
Performance Results
Success criteria:
- Sensitivity ≥ 0.95 (correctly identify valid dermatological images)
- Specificity ≥ 0.99 (correctly reject non-dermatological images)
- False positive rate ≤ 1% (minimize incorrect rejections)
| Metric | Value | Criterion | Outcome |
|---|---|---|---|
| Non-dermatology precision | 0.9855 (95% CI: [0.9828-0.9882]) | ≥ 0.95 | PASS |
| Non-dermatology recall | 0.9978 (95% CI: [0.9967-0.9988]) | ≥ 0.90 | PASS |
| Clinical f1-score | 0.9975 (95% CI: [0.9973-0.9978]) | ≥ 0.90 | PASS |
| Dermoscopic f1-score | 0.9950 (95% CI: [0.9942-0.9957]) | ≥ 0.90 | PASS |
| Accuracy | 0.9965 (95% CI: [0.9961-0.9969]) | ≥ 95% | PASS |
| Macro avg f1-score | 0.9947 (95% CI: [0.9940-0.9953]) | ≥ 0.90 | PASS |
| Weighted avg f1-score | 0.9965 (95% CI: [0.9961-0.9969]) | ≥ 0.90 | PASS |
Verification and Validation Protocol
Test Design:
- A set of 81008 images, including clinical, dermoscopy, and non-dermatology images.
- The dermatology image subset is heterogeneous in terms of sex, age, and skin type.
Complete Test Protocol:
- Input: Mixed dataset of in-domain and out-of-domain images
- Processing: Multi-class classification
- Output: Probability vector
- Ground truth: Expert-confirmed domain labels (clinical, dermoscopic, non-dermatology)
- Statistical analysis: Precision, recall, F-1 score, accuracy with confidence intervals (bootstrap method).
Data Analysis Methods:
- Precision, recall, F-1 score, accuracy (with bootstrap confidence intervals)
Test Conclusions:
- The model met all success criteria, demonstrating excellent performance for all classes (clinical, dermoscopic, non-dermatology).
- Due to the simplicity of the task, it is possible to leverage a very small and lightweight model (EfficientNet-B0) that is capable of learning to separate all three classes.
Bias Analysis and Fairness Evaluation
To assess model and data bias, we filtered the previously mentioned set of 81008 images to keep only the clinical and dermoscopic images. The model's predictions were then evaluated across sex, age, and Fitzpatrick skin type (FST). The reason behind filtering this test set is that non-dermatology images cannot be categorized in terms of sex, age, and skin type.
Objective: Ensure domain validation doesn't unfairly reject valid dermatological images from any subpopulation.
Subpopulation Analysis Protocol:
1. Fitzpatrick Skin Type Analysis:
- Equal F-1 score across all Fitzpatrick types
- Success criterion: No correlation between skin type and false rejection
2. Sex and Age Analysis:
- Consistent performance across sex and age groups
- Success criterion: No sex or age-specific rejection bias
Bias Mitigation Strategies:
- Image augmentation including color and lighting variations during training.
- Pre-training on diverse data to improve generalization.
Results Summary:
| Group | clinical f1-score | dermoscopic f1-score | accuracy | weighted avg f1-score |
|---|---|---|---|---|
| I-II | 0.9972 (95% CI: [0.9968-0.9976]) | 0.9954 (95% CI: [0.9947-0.9961]) | 0.9962 (95% CI: [0.9956-0.9967]) | 0.9966 (95% CI: [0.9961-0.9971]) |
| III-IV | 0.9990 (95% CI: [0.9987-0.9993]) | 0.9915 (95% CI: [0.9875-0.9952]) | 0.9982 (95% CI: [0.9976-0.9987]) | 0.9987 (95% CI: [0.9983-0.9991]) |
| V-VI | 0.9857 (95% CI: [0.9809-0.9902]) | 0.7526 (95% CI: [0.5600-0.9092]) | 0.9714 (95% CI: [0.9622-0.9801]) | 0.9838 (95% CI: [0.9784-0.9887]) |
| Group | clinical f1-score | dermoscopic f1-score | accuracy | weighted avg f1-score |
|---|---|---|---|---|
| Newborn | 0.9790 (95% CI: [1.0000-1.0000]) | 0.9990 (95% CI: [1.0000-1.0000]) | 1.0000 (95% CI: [1.0000-1.0000]) | 1.0000 (95% CI: [1.0000-1.0000]) |
| Child | 1.0000 (95% CI: [1.0000-1.0000]) | 1.0000 (95% CI: [1.0000-1.0000]) | 1.0000 (95% CI: [1.0000-1.0000]) | 1.0000 (95% CI: [1.0000-1.0000]) |
| Adolescent | 0.9946 (95% CI: [0.9858-1.0000]) | 0.9993 (95% CI: [0.9983-1.0000]) | 0.9987 (95% CI: [0.9969-1.0000]) | 0.9987 (95% CI: [0.9970-1.0000]) |
| Adult | 0.9990 (95% CI: [0.9988-0.9993]) | 0.9971 (95% CI: [0.9961-0.9979]) | 0.9985 (95% CI: [0.9981-0.9989]) | 0.9986 (95% CI: [0.9982-0.9990]) |
| Geriatric | 0.9986 (95% CI: [0.9981-0.9990]) | 0.9952 (95% CI: [0.9938-0.9966]) | 0.9976 (95% CI: [0.9969-0.9983]) | 0.9977 (95% CI: [0.9971-0.9984]) |
| Group | clinical f1-score | dermoscopic f1-score | accuracy | weighted avg f1-score |
|---|---|---|---|---|
| Female | 0.9981 (95% CI: [0.9977-0.9985]) | 0.9958 (95% CI: [0.9947-0.9969]) | 0.9973 (95% CI: [0.9966-0.9979]) | 0.9975 (95% CI: [0.9968-0.9980]) |
| Male | 0.9987 (95% CI: [0.9983-0.9990]) | 0.9956 (95% CI: [0.9946-0.9966]) | 0.9978 (95% CI: [0.9973-0.9983]) | 0.9979 (95% CI: [0.9974-0.9984]) |
Bias Analysis Conclusion:
- Overall, the model offers a robust performance across skin type, sex, and age.
- The lower proportion of dermoscopy images of dark skin limits model performance for those specific demographic groups under that imaging modality.
Head Detection
Model Overview
Reference: R-TF-028-001 AI/ML Description - Head Detection section
This AI model detects and localizes human heads in images.
Clinical Significance: Automated head detection enables precise head surface analysis by ensuring proper head-centered framing.
Data Requirements and Annotation
Foundational annotation: ICD-11 mapping (completed)
Model-specific annotation: Head detection (R-TF-028-024 Data Annotation Instructions - Non-clinical Data)
Images were annotated with tight rectangular bounding boxes around head regions. Each bounding box is defined by its four corner coordinates (x_min, y_min, x_max, y_max), delineating the region containing the head with minimal background.
Dataset statistics:
- Images with head annotations: 826 images of head with and without skin pathologies
- Training set: 661 images
- Validation set: 165 images
Training Methodology
Architecture: YOLOv8-S model
- Deep learning model tailored for single-class object detection.
- Transfer learning from pre-trained COCO weights
- Input size: 480x480 pixels
Training approach:
The model has been trained with the Ultralytics framework using the following hyperparameters:
- Optimizer: AdamW with learning rate 0.001 and cosine annealing scheduler
- Batch size: 16
- Training duration: 150 epochs with early stopping
Pre-processing:
- Input images were resized and padded to 480x480 pixels.
- Data augmentation: geometric, color, light, and mosaic augmentations.
Post-processing:
- Confidence threshold of 0.25 to filter low-confidence predictions.
- Non-maximum suppression (NMS) with IoU threshold of 0.7 to eliminate overlapping boxes.
Remaining hyperparameters are set to the default values of the Ultralytics framework.
Performance Results
Performance is evaluated using mean Average Precision at IoU=0.5 (mAP@50) to account for correct head localization. Statistics are calculated with 95% confidence intervals using bootstrapping (1000 samples). Success criteria is defined as mAP@50 ≥ 0.86 to account for detection performance superior to the average performance of published head detection studies.
| Metric | Result | Success Criterion | Outcome |
|---|---|---|---|
| mAP@50 | 0.99 (0.99-0.99) | ≥ 0.86 | PASS |
Verification and Validation Protocol
Test Design:
- Expert-annotated bounding boxes used as reference standard for validation.
- Evaluation across diverse skin tones and image quality levels.
Complete Test Protocol:
- Input: RGB images from validation set with expert head annotations
- Processing: Object detection inference with NMS
- Output: Predicted bounding boxes with confidence scores and head counts
- Reference standard: Expert-annotated boxes
- Statistical analysis: mAP@50 with 95% confidence intervals
Data Analysis Methods:
- Precision-Recall and F1-confidence curves
- mAP calculation at IoU=0.5 (mAP@50)
- Mean Absolute Error (MAE) between predicted and reference standard head counts
Test Conclusions:
- The model met all success criteria, demonstrating reliable head detection performance suitable for supporting image standardization workflows.
- The model demonstrates superior performance to the average performance of previously published head detection studies.
- The model's performance is within acceptable limits and shows excellent generalization.
Bias Analysis and Fairness Evaluation
Objective: Ensure head detection performs consistently across demographic subpopulations.
Subpopulation Analysis Protocol:
1. Fitzpatrick Skin Tone Analysis:
- Performance stratified by Fitzpatrick skin tones: I-II (light), III-IV (medium), V-VI (dark)
- Success criterion: mAP@50 ≥ 0.86 for all skin tone groups
| Subpopulation | Num. training samples | Num. val samples | mAP@50 | Outcome |
|---|---|---|---|---|
| Fitzpatrick I-II | 368 | 102 | 0.99 (0.99-0.99) | PASS |
| Fitzpatrick III-IV | 223 | 44 | 0.99 (0.97-0.99) | PASS |
| Fitzpatrick V-VI | 70 | 19 | 0.99 (0.99-0.99) | PASS |
Results Summary:
- The model demonstrated excellent performance across all Fitzpatrick skin tones, meeting all success criteria.
- No significant performance disparities were observed among skin tone categories.
- The model shows robust generalization across diverse skin tones.
Bias Mitigation Strategies:
- Image augmentation including color and lighting variations during training
- Pre-training on diverse data to improve generalization
- Balanced representation of skin tones in the training dataset
Bias Analysis Conclusion:
- The model demonstrated consistent and excellent performance across all Fitzpatrick skin tones, with all success criteria met.
- No performance disparities were observed, indicating fairness in head detection across diverse populations.
- The model is suitable for deployment in diverse clinical and telemedicine settings.
Summary and Conclusion
The development and validation activities described in this report provide objective evidence that the AI algorithms for Legit.Health Plus meet their predefined specifications and performance requirements.
Status of model development and validation:
- ICD Category Distribution and Binary Indicators: All predefined success criteria met. Top-1 accuracy 65.8% (≥50%), Top-3 accuracy 82.1% (≥60%), Top-5 accuracy 86.4% (≥70%). All six binary indicator AUCs exceed 0.80 (range: 0.863–0.959). Bias analysis completed across Fitzpatrick skin types, age groups, sex, and image modality. Model verified, validated, and approved for release.
- Visual Sign Intensity Models: All 10 models (erythema, desquamation, induration, pustule, crusting, xerosis, swelling, oozing, excoriation, lichenification) meet their respective RMAE success criteria (range: 0.106–0.190). Bias analysis completed for all models across Fitzpatrick skin types and severity subgroups. All models verified, validated, and approved for release.
- Lesion Quantification Models: All 5 lesion quantification models (wound characteristics, inflammatory nodular lesions, acneiform lesion types, hair follicle, acneiform inflammatory lesions, hive lesions) and 2 pattern identification models meet their predefined success criteria. Wound characteristic balanced accuracies range from 64.6%–73.9% (all ≥50%). Lesion counting mAP@50 values meet all thresholds. All models verified, validated, and approved for release.
- Surface Area Models: All 12 surface quantification models (body surface, wound surface with 8 tissue subtypes, erythema surface, hair loss surface, nail lesion surface, hypopigmentation surface, hyperpigmentation surface) meet their IoU or RMAE success criteria. IoU values range from 0.50 to 0.91. Bias analysis completed across Fitzpatrick skin types. All models verified, validated, and approved for release.
- Non-Clinical Support Models: All 5 non-clinical models (DIQA, Domain Validation, Skin Surface Segmentation, Body Surface Segmentation, Head Detection) meet their predefined success criteria. DIQA achieves PLCC 0.896 and SROCC 0.903 (≥0.70). Domain Validation accuracy 99.65% (≥95%). Skin Surface Segmentation IoU 0.97 (≥0.83). Body Surface Segmentation IoU 0.91 (≥0.85). Head Detection mAP@50 0.99 (≥0.86). All models verified, validated, and approved for release.
The development process adhered to the company's QMS and followed Good Machine Learning Practices. Models meeting their success criteria are considered verified, validated, and suitable for release and integration into the Legit.Health Plus medical device.
State of the Art Compliance and Development Lifecycle
Software Development Lifecycle Compliance
The AI models in Legit.Health Plus were developed in accordance with state-of-the-art software development practices and international standards:
Applicable Standards and Guidelines:
- IEC 62304:2006+AMD1:2015 - Medical device software lifecycle processes
- ISO 13485:2016 - Quality management systems for medical devices
- ISO 14971:2019 - Application of risk management to medical devices
- ISO/IEC 25010:2011 - Systems and software quality requirements and evaluation (SQuaRE)
- FDA Guidance on Software as a Medical Device (SAMD) - Clinical evaluation and predetermined change control plans
- IMDRF/SaMD WG/N41 FINAL:2017 - Software as a Medical Device: Key Definitions
- Good Machine Learning Practice (GMLP) - FDA/Health Canada/UK MHRA Guiding Principles (2021)
- Proposed Regulatory Framework for Modifications to AI/ML-Based SaMD - FDA Discussion Paper (2019)
Development Lifecycle Phases Implemented:
- Requirements Analysis: Comprehensive AI model specifications defined in
R-TF-028-001 AI/ML Description - Development Planning: Structured development plan in
R-TF-028-002 AI Development Plan - Risk Management: AI-specific risk analysis in
R-TF-028-011 AI Risk Matrix - Design and Architecture: State-of-the-art architectures (Vision Transformers, CNNs, object detection, segmentation)
- Implementation: Following coding standards and version control practices
- Verification: Unit testing, integration testing, and algorithm validation
- Validation: Clinical performance testing against predefined success criteria
- Release: Version-controlled releases with complete traceability
- Maintenance: Post-market surveillance and performance monitoring
Version Control and Traceability:
- All model versions tracked in version control systems (Git)
- Complete traceability from requirements to validation results
- Dataset versions documented with checksums and provenance
- Model artifacts stored with complete training metadata
- Documented change control process for model updates
State of the Art in AI Development
Best Practices Implemented:
1. Data Management Excellence:
- Multi-source data collection with demographic diversity
- Rigorous data quality control and curation processes
- Systematic annotation protocols with multi-expert consensus
- Data partitioning strategies preventing data leakage
- Sequestered test sets for unbiased evaluation
2. Model Architecture Selection:
- Use of state-of-the-art architectures (Vision Transformers for classification, YOLO/Faster R-CNN for detection, U-Net/DeepLab for segmentation)
- Transfer learning from large-scale pre-trained models
- Architecture selection based on published benchmark performance
- Justification of architecture choices documented per model
3. Training Best Practices:
- Systematic hyperparameter optimization
- Cross-validation and early stopping to prevent overfitting
- Data augmentation for robustness and generalization
- Multi-task learning where clinically appropriate
- Monitoring of training metrics and convergence
4. Model Calibration and Post-Processing:
- Temperature scaling for probability calibration
- Test-time augmentation for robust predictions
- Ensemble methods where applicable
- Uncertainty quantification for model predictions
5. Comprehensive Validation:
- Independent test sets never used during development
- External validation on diverse datasets
- Clinical reference standard from expert consensus
- Statistical rigor with confidence intervals
- Comprehensive subpopulation analysis
6. Bias Mitigation and Fairness:
- Systematic bias analysis across demographic subpopulations
- Fitzpatrick skin type stratification in all analyses
- Data collection strategies ensuring demographic diversity
- Bias monitoring models (DIQA, Fitzpatrick identification)
- Transparent reporting of performance disparities
7. Explainability and Transparency:
Explainability is a fundamental requirement for AI-based medical devices under the EU AI Act (Regulation (EU) 2024/1689, Article 13) and MDR 2017/745 (GSPR 23.4). The Legit.Health Plus AI models are designed as clinical decision support tools — they do not autonomously make clinical decisions. Nonetheless, the following explainability methods are implemented to ensure that healthcare professionals can understand, interpret, and appropriately trust the AI outputs:
7.1. Output-Level Explainability (Inherent Transparency):
All models in the Legit.Health Plus device produce outputs that are inherently interpretable by design:
- ICD Category Distribution: The model outputs a ranked probability distribution over 346 ICD-11 categories, presenting the top-5 most probable categories with associated confidence scores. This probabilistic output format allows clinicians to evaluate the differential and apply their own clinical judgment. The model does not produce a single deterministic diagnosis — it presents a distribution that mirrors clinical reasoning.
- Visual Sign Intensity Quantification: Each model outputs a continuous score on a clinically validated 0–9 ordinal scale (or equivalent clinical scale). These scores directly correspond to established clinical grading systems (e.g., SCORAD, PASI component scores), making the output directly interpretable by dermatologists trained in these scoring systems.
- Lesion Detection and Counting: Object detection models produce bounding boxes with class labels and confidence scores overlaid on the original image. This spatial localization allows clinicians to visually verify which structures the model identified and assess whether the detections correspond to true lesions.
- Surface Area Quantification: Segmentation models produce pixel-level masks that are rendered as colored overlays on the input image. Clinicians can directly inspect the delineated regions and assess agreement with their own clinical assessment of affected area.
- Binary Indicators: Each indicator is derived deterministically from the ICD probability distribution via a documented mapping matrix (
binary_indicator_mapping.csv). The derivation logic is fully transparent and auditable. - Pattern Identification: Pattern models output class probabilities (e.g., Hurley staging probabilities), allowing clinicians to evaluate the model's confidence across staging categories.
7.2. Attention-Based Interpretability:
For models based on the ConvNeXt-V2 architecture, attention maps can be extracted to visualize which image regions contributed most to the model's prediction:
- Self-attention maps from transformer layers highlight spatially relevant regions of the input image that the model focuses on during classification.
- Grad-CAM (Gradient-weighted Class Activation Mapping) is applicable to both CNN-based (EfficientNetV2, ConvNeXt-V2) and transformer-based architectures. It produces class-discriminative localization maps that indicate which regions of the image are most important for a particular prediction.
- These visualization methods are available as diagnostic tools during development and post-market performance investigation. They are not exposed in the clinical user interface, as the primary explainability mechanism is the inherent transparency of the structured outputs.
7.3. Uncertainty Quantification:
- Calibrated probability outputs: Temperature scaling is applied to classification models to ensure that output probabilities are well-calibrated — i.e., a predicted probability of 0.8 corresponds to approximately 80% empirical accuracy. Calibration results are documented per model in the Performance Results sections of this report.
- Confidence scores: All outputs include associated confidence or probability values that indicate the model's certainty. Low-confidence predictions can be flagged for additional clinical review.
- Test-Time Augmentation (TTA): Multiple augmented versions of the input image are processed, and predictions are averaged. The variance across TTA predictions provides an implicit measure of prediction stability.
7.4. Limitations and Failure Mode Documentation:
- All known model limitations are documented in the Bias Analysis sections of this report, including performance variations across demographic subgroups, underrepresented populations, and challenging clinical presentations.
- Known failure modes identified during robustness testing are documented per model.
- The Known Limitations section of
R-TF-028-006 AI Release Reportprovides a consolidated summary for the Software Development team.
7.5. Clinical Communication and Transparency:
- The Instructions for Use (IFU) clearly communicates that the AI outputs are decision support information, not autonomous diagnoses.
- The intended user (healthcare professional) is informed about the types of AI models used, their intended purpose, and the appropriate clinical context for interpreting outputs.
- Performance characteristics, including sensitivity, specificity, and demographic performance variations, are disclosed in clinical documentation.
7.6. Regulatory Compliance:
The explainability approach implemented satisfies:
- EU AI Act Article 13 (Transparency): High-risk AI systems must be designed to allow users to interpret the output and use it appropriately. The structured, probabilistic outputs with confidence scores meet this requirement.
- EU AI Act Article 14 (Human Oversight): The system is designed to be effectively overseen by healthcare professionals. All outputs require clinical interpretation before any treatment decision.
- MDR Annex I GSPR 23.4: Software intended for clinical decision support provides sufficient information for the user to understand the basis of the output.
- Good Machine Learning Practice Principle 6 (FDA/Health Canada/MHRA): "Model design is tailored to the available data and reflects the intended use of the device." The inherent interpretability of structured clinical outputs supports this principle.
Risk Management Throughout Lifecycle
Risk Management Process:
Risk management is integrated throughout the entire AI development lifecycle following ISO 14971:
1. Risk Analysis:
- Identification of AI-specific hazards (data bias, model errors, distribution shift)
- Hazardous situation analysis (incorrect predictions leading to clinical harm)
- Risk estimation combining probability and severity
2. Risk Evaluation:
- Comparison of risks against predefined acceptability criteria
- Benefit-risk analysis for each AI model
- Clinical impact assessment of potential errors
3. Risk Control:
- Inherent safety by design (offline models, no learning from deployment data)
- Protective measures (DIQA quality scoring, domain validation classification, confidence thresholds)
- Information for safety (user training, clinical decision support context)
4. Residual Risk Evaluation:
- Assessment of risks after control measures
- Verification that all risks reduced to acceptable levels
- Overall residual risk acceptability
5. Risk Management Review:
- Production and post-production information review
- Update of risk management file
- Traceability to safety risk matrix (
R-TF-028-011 AI Risk Matrix)
AI-Specific Risk Controls:
- Data Quality Risks: Multi-source collection, systematic annotation, quality control
- Model Overfitting: Sequestered test sets, cross-validation, regularization
- Bias and Fairness: Demographic diversity, subpopulation analysis, bias monitoring
- Model Uncertainty: Calibration, confidence scores, uncertainty quantification
- Distribution Shift: Domain validation classification, DIQA quality scoring, performance monitoring
- Clinical Misinterpretation: Clear communication, clinical context, user training
Information Security
Cybersecurity Considerations:
The AI models are designed with information security principles integrated throughout development:
1. Model Security:
- Model parameters stored securely with access controls
- Model integrity verification (checksums, digital signatures)
- Protection against model extraction or reverse engineering
- Secure deployment pipelines
2. Data Security:
- Patient data protection throughout development (de-identification, anonymization)
- Secure data storage with encryption at rest
- Secure data transmission with encryption in transit
- Access controls and audit logging for training data
3. Inference Security:
- Secure API endpoints for model inference
- Input validation to prevent adversarial attacks
- Rate limiting and authentication
- Output validation and sanity checking
4. Privacy Considerations:
- No patient-identifiable information stored in models
- Training data anonymization and de-identification
- Compliance with GDPR, HIPAA, and applicable privacy regulations
- Data minimization principles applied
5. Vulnerability Management:
- Regular security assessments of AI infrastructure
- Dependency scanning for software libraries
- Patch management for underlying frameworks
- Incident response procedures
6. Adversarial Robustness:
- Consideration of adversarial attack scenarios
- Input preprocessing to detect anomalous inputs
- Domain Validation to flag out-of-distribution inputs (informational output included in the API response)
- DIQA scoring to flag manipulated or low-quality images (informational output included in the API response)
Cybersecurity Risk Assessment:
Cybersecurity risks are addressed in the overall device risk management file, including:
- Threat modeling for AI components
- Attack surface analysis
- Mitigation strategies and security controls
- Monitoring and incident response
Verification and Validation Strategy
Verification Activities (confirming that the AI models implement their specifications):
- Code reviews and static analysis
- Unit testing of model components
- Integration testing of model pipelines
- Architecture validation against specifications
- Performance benchmarking against target metrics
Validation Activities (confirming that AI models meet intended use):
- Independent test set evaluation with sequestered data
- External validation on diverse datasets
- Clinical reference standard comparison
- Subpopulation performance analysis
- Real-world performance assessment
- Usability and clinical workflow validation
Documentation of Verification and Validation:
Complete documentation is maintained for all verification and validation activities:
- Test protocols with detailed methodology
- Complete test results with statistical analysis
- Data summaries and test conclusions
- Traceability from requirements to test results
- Identified deviations and their resolutions
This comprehensive approach ensures compliance with GSPR 17.2 requirements for software development in accordance with state of the art, incorporating development lifecycle management, risk management, information security, verification, and validation.
Integration Verification Package
To ensure that the AI models produce identical outputs when integrated into the Legit.Health Plus software environment as they did during development and validation, an Integration Verification Package has been prepared for each model in accordance with GP-028 AI Development.
Purpose
The Integration Verification Package enables the Software Development team to:
- Verify that models are correctly integrated without alterations to their inference behavior
- Detect any environment discrepancies that could affect model outputs
- Provide objective evidence of output equivalence between development and production environments
- Support regulatory compliance by demonstrating traceability between development validation and deployed system verification per IEC 62304
Package Location and Structure
All Integration Verification Packages are stored in the secure, version-controlled S3 bucket with the following structure:
s3://legit-health-plus/integration-verification/
├── icd-category-distribution/
│   ├── images/
│   ├── expected_outputs.csv
│   └── manifest.json
├── erythema-intensity/
│   ├── images/
│   ├── expected_outputs.csv
│   └── manifest.json
├── desquamation-intensity/
│   ├── images/
│   ├── expected_outputs.csv
│   └── manifest.json
├── induration-intensity/
│   ├── images/
│   ├── expected_outputs.csv
│   └── manifest.json
├── pustule-intensity/
│   ├── images/
│   ├── expected_outputs.csv
│   └── manifest.json
├── [... additional models ...]
├── diqa/
│   ├── images/
│   ├── expected_outputs.csv
│   └── manifest.json
└── domain-validation/
    ├── images/
    ├── expected_outputs.csv
    └── manifest.json
Package Contents Per Model
For each AI model in the Legit.Health Plus device, the Integration Verification Package includes:
Reference Test Images
- Location:
s3://legit-health-plus/integration-verification/{MODEL_NAME}/images/ - Content: A curated subset of images from the model's held-out test set
- Selection Criteria: Images representative of the model's input domain, including diverse categories, demographics, and imaging modalities
- Format: Original image format (JPEG/PNG) without additional processing
Expected Outputs File
- Location:
s3://legit-health-plus/integration-verification/{MODEL_NAME}/expected_outputs.csv - Schema:
| Column | Type | Description |
|---|---|---|
image_id | string | Unique identifier matching the image filename |
expected_output | string/float | Model's expected output (JSON-encoded for complex outputs) |
output_type | string | Output category: classification_probability, regression_value, segmentation_mask_hash, detection_boxes |
preprocessing_hash | string | SHA-256 hash of the preprocessed input tensor |
- Generation: Outputs generated from the validated development model using the exact configuration documented in this report
Verification Manifest
- Location:
s3://legit-health-plus/integration-verification/{MODEL_NAME}/manifest.json - Contents:
{
  "model_name": "erythema-intensity",
  "model_version": "1.0.0",
  "package_version": "1.0.0",
  "creation_timestamp": "2026-01-27T10:00:00Z",
  "created_by": "AI Team",
  "num_test_images": 100,
  "model_weights_sha256": "abc123...",
  "preprocessing": {
    "resize": [272, 272],
    "normalization": "imagenet",
    "color_space": "RGB"
  },
  "acceptance_criteria": {
    "metric": "output_tolerance",
    "tolerance": 1e-5,
    "pass_rate_required": 1.0
  },
  "development_report_reference": "R-TF-028-005 v1.0"
}
Acceptance Criteria
The following acceptance criteria apply to integration verification:
| Model Type | Metric | Acceptance Criterion |
|---|---|---|
| Classification (ICD, Binary Indicators) | Probability difference | ε ≤ 1e-5 per class |
| Intensity Quantification | Output score difference | ε ≤ 1e-5 |
| Segmentation | Mask IoU | ≥ 0.9999 |
| Detection | Box IoU + class match | IoU ≥ 0.9999, exact class match |
| Quality Assessment (DIQA) | Score difference | ε ≤ 1e-5 |
Overall Pass Criterion: 100% of test images must meet the acceptance criteria for the integration verification to pass.
Model-Specific Package Details
The following table summarizes the Integration Verification Package for each model:
Clinical Models - ICD Classification and Binary Indicators
| Model | Output Type | Storage Path |
|---|---|---|
| ICD Category Distribution | Classification probabilities (346 classes) | icd-category-distribution/ |
| Binary Indicators | 6 probability scores | icd-category-distribution/ |
Clinical Models - Visual Sign Intensity Quantification
| Model | Output Type | Storage Path |
|---|---|---|
| Erythema Intensity | Regression (0-9 scale) | erythema-intensity/ |
| Desquamation Intensity | Regression (0-9 scale) | desquamation-intensity/ |
| Induration Intensity | Regression (0-9 scale) | induration-intensity/ |
| Pustule Intensity | Regression (0-9 scale) | pustule-intensity/ |
| Crusting Intensity | Regression (0-9 scale) | crusting-intensity/ |
| Xerosis Intensity | Regression (0-9 scale) | xerosis-intensity/ |
| Swelling Intensity | Regression (0-9 scale) | swelling-intensity/ |
| Oozing Intensity | Regression (0-9 scale) | oozing-intensity/ |
| Excoriation Intensity | Regression (0-9 scale) | excoriation-intensity/ |
| Lichenification Intensity | Regression (0-9 scale) | lichenification-intensity/ |
Clinical Models - Wound Characteristic Assessment
| Model | Output Type | Storage Path |
|---|---|---|
| Wound Edge: Diffused | Binary classification | wound-edge-diffused/ |
| Wound Edge: Thickened | Binary classification | wound-edge-thickened/ |
| Wound Edge: Delimited | Binary classification | wound-edge-delimited/ |
| Wound Edge: Indistinguishable | Binary classification | wound-edge-indistinguishable/ |
| Wound Edge: Damaged | Binary classification | wound-edge-damaged/ |
| Wound Tissue: Bone | Binary classification | wound-tissue-bone/ |
| Wound Tissue: Subcutaneous | Binary classification | wound-tissue-subcutaneous/ |
| Wound Tissue: Muscle | Binary classification | wound-tissue-muscle/ |
| Wound Tissue: Intact | Binary classification | wound-tissue-intact/ |
| Wound Tissue: Dermis-Epidermis | Binary classification | wound-tissue-dermis-epidermis/ |
| Wound Bed: Necrotic | Binary classification | wound-bed-necrotic/ |
| Wound Bed: Closed | Binary classification | wound-bed-closed/ |
| Wound Bed: Granulation | Binary classification | wound-bed-granulation/ |
| Wound Bed: Epithelial | Binary classification | wound-bed-epithelial/ |
| Wound Bed: Slough | Binary classification | wound-bed-slough/ |
| Wound Exudate: Serous | Binary classification | wound-exudate-serous/ |
| Wound Exudate: Fibrinous | Binary classification | wound-exudate-fibrinous/ |
| Wound Exudate: Purulent | Binary classification | wound-exudate-purulent/ |
| Wound Exudate: Bloody | Binary classification | wound-exudate-bloody/ |
| Perilesional Erythema | Binary classification | perilesional-erythema/ |
| Perilesional Maceration | Binary classification | perilesional-maceration/ |
| Biofilm Tissue | Binary classification | biofilm-tissue/ |
| Wound Stage Classification | Multi-class (6 stages) | wound-stage/ |
| Wound Intensity (AWOSI) | Regression (0-10 scale) | wound-awosi/ |
Clinical Models - Lesion Quantification
| Model | Output Type | Storage Path |
|---|---|---|
| Inflammatory Nodular Lesion | Detection (bounding boxes + count) | inflammatory-nodular/ |
| Acneiform Lesion Types | Multi-class detection (5 classes) | acneiform-lesion-types/ |
| Inflammatory Lesion | Detection (bounding boxes + count) | inflammatory-lesion/ |
| Hive Lesion | Detection (bounding boxes + count) | hive-lesion/ |
| Nail Lesion Surface | Segmentation mask | nail-lesion-surface/ |
Clinical Models - Surface Area Quantification
| Model | Output Type | Storage Path |
|---|---|---|
| Wound Bed Surface | Segmentation mask | wound-bed-surface/ |
| Wound Granulation Surface | Segmentation mask | wound-granulation-surface/ |
| Wound Biofilm/Slough Surface | Segmentation mask | wound-biofilm-surface/ |
| Wound Necrosis Surface | Segmentation mask | wound-necrosis-surface/ |
| Wound Maceration Surface | Segmentation mask | wound-maceration-surface/ |
| Wound Orthopedic Material Surface | Segmentation mask | wound-orthopedic-surface/ |
| Wound Bone/Cartilage/Tendon Surface | Segmentation mask | wound-bone-surface/ |
| Hair Loss Surface | Segmentation mask | hair-loss-surface/ |
| Hypopigmentation/Depigmentation | Segmentation mask | hypopigmentation-surface/ |
| Hyperpigmentation Surface | Segmentation mask | hyperpigmentation-surface/ |
| Erythema Surface | Segmentation mask | erythema-surface/ |
Clinical Models - Pattern Identification
| Model | Output Type | Storage Path |
|---|---|---|
| Acneiform Inflammatory Pattern | Regression (IGA 0-4 scale) | acneiform-pattern/ |
| Follicular and Inflammatory Pattern | Multi-class (Hurley stages) | follicular-inflammatory-pattern/ |
| Inflammatory Pattern | Classification | inflammatory-pattern/ |
| Inflammatory Pattern Indicator | Binary classification | inflammatory-pattern-indicator/ |
Non-Clinical Models
| Model | Output Type | Storage Path |
|---|---|---|
| DIQA | Quality score (0-1) | diqa/ |
| Domain Validation | Classification (3 classes) | domain-validation/ |
| Skin Surface Segmentation | Segmentation mask | skin-surface-segmentation/ |
| Body Surface Segmentation | Segmentation mask | body-surface-segmentation/ |
| Head Detection | Detection (bounding boxes) | head-detection/ |
Verification Procedure for Software Integration Team
The Software Development team shall follow this procedure after model integration:
-
Environment Preparation:
- Configure the integration environment with dependencies specified in
R-TF-028-006 AI Release Report - Download the Integration Verification Package from S3
- Verify package integrity using manifest checksums
- Configure the integration environment with dependencies specified in
-
Inference Execution:
- Process all reference test images through the integrated model
- Record outputs in the same format as
expected_outputs.csv - Document runtime environment configuration
-
Output Comparison:
- Compare actual outputs against expected outputs using acceptance criteria
- Calculate match rate for each image
- Flag any discrepancies
-
Results Documentation:
- Generate Integration Verification Report including:
- Test execution date and environment details
- Pass/fail status per image
- Overall pass rate
- Any deviations with root cause analysis
- Store report as software verification evidence per IEC 62304
- Generate Integration Verification Report including:
Traceability
| Artifact | Version | Reference |
|---|---|---|
| AI Development Report | 1.0 | This document |
| AI Release Report | 1.0 | R-TF-028-006 |
| Integration Verification Package | 1.0 | S3 bucket |
| Model Weights | Per model | See manifest.json |
The Integration Verification Package version is locked to the corresponding model version and AI Development Report. Any model retraining requires generation of a new Integration Verification Package.
AI Risks Assessment Report
AI Risk Assessment
A comprehensive risk assessment was conducted throughout the development lifecycle in accordance with the R-TF-028-002 AI Development Plan. All identified AI-specific risks related to data, model training, and performance were documented and analyzed in the R-TF-028-011 AI Risk Matrix.
AI Risk Treatment
Control measures were implemented to mitigate all identified risks. Key controls included:
- Rigorous data curation and multi-source collection to mitigate bias.
- Systematic model training and validation procedures to prevent overfitting.
- Use of a sequestered test set to ensure unbiased performance evaluation.
- Implementation of model calibration to improve the reliability of outputs.
Residual AI Risk Assessment
After the implementation of control measures, a residual risk analysis was performed. All identified AI risks were successfully reduced to an acceptable level.
AI Risk and Traceability with Safety Risk
Safety risks related to the AI algorithms (e.g., incorrect assessment suggestion, misinterpretation of data) were identified and traced back to their root causes in the AI development process. These safety risks have been escalated for management in the overall device Safety Risk Matrix, in line with ISO 14971.
Conclusion
The AI development process has successfully managed and mitigated inherent risks to an acceptable level. The benefits of using the Legit.Health Plus algorithms as a clinical decision support tool are judged to outweigh the residual risks.
Related Documents
Project Design and Plan
R-TF-028-001 AI/ML Description- Complete specifications for all AI modelsR-TF-028-002 AI Development Plan- Development methodology and lifecycleR-TF-028-011 AI Risk Matrix- AI-specific risk assessment and mitigation
Data Collection and Annotation
R-TF-028-003 Data Collection Instructions- Public datasets and clinical study data collection protocolsR-TF-028-004 Data Annotation Instructions - ICD-11 Mapping- Foundational clinical label standardization (completed)R-TF-028-004 Data Annotation Instructions - Visual Signs- Intensity, count, and extent annotations for visual sign models (completed)
Synthetic Data
R-TF-028-012 Synthetic Data Generation Protocol- Controlled pipeline for generating synthetic Fitzpatrick V–VI images for bias evaluation
Signature meaning
The signatures for the approval process of this document can be found in the verified commits at the repository for the QMS. As a reference, the team members who are expected to participate in this document and their roles in the approval process, as defined in Annex I Responsibility Matrix of the GP-001, are:
- Author: Team members involved
- Reviewer: JD-003 Design & Development Manager, JD-004 Quality Manager & Person Responsible for Regulatory Compliance (PRRC)
- Approver: JD-001 General Manager
ㅤㅤ ㅤㅤ