R-009-001 Implementation Plan: Visiba Integration Enhancement
Executive Summary
Following our meeting on September 25, 2025, where Oscar from Visiba Care demonstrated the Red Robin triage engine and its integration with Legit.Health, we have identified significant opportunities to enhance the value delivered to Visiba Care's customers.
Key Findings
- Visiba Care has built a sophisticated Bayesian network-based triage system that effectively integrates Legit.Health's diagnostic support capabilities
- The current integration successfully uses the diagnosis probability distribution to inform Red Robin's decision matrix
- Several high-value API features remain untapped, representing significant opportunities to reduce engineering workload and increase customer value
Objective
This document provides a strategic roadmap for Visiba Care to maximize the return on their Legit.Health integration across four implementation phases.
Current Integration Assessment
What Works Well
Based on the September 2025 demonstration, the current integration demonstrates:
| Capability | Implementation Status | Assessment |
|---|---|---|
| Diagnosis probability distribution | Fully integrated | Excellent |
| Bayesian network integration | Fully integrated | Sophisticated |
| Condition mapping (~100 diagnoses) | Manually maintained | Functional but labor-intensive |
| Confusion matrix adjustments | Implemented | Good error handling |
| Image capture workflow | Integrated | Effective |
Understanding the Three Capability Types
The API provides three fundamentally different types of clinical intelligence, each serving a distinct purpose. These are often conflated, but understanding the distinction is essential for maximizing the integration's value.
Diagnosis
What does this person have?
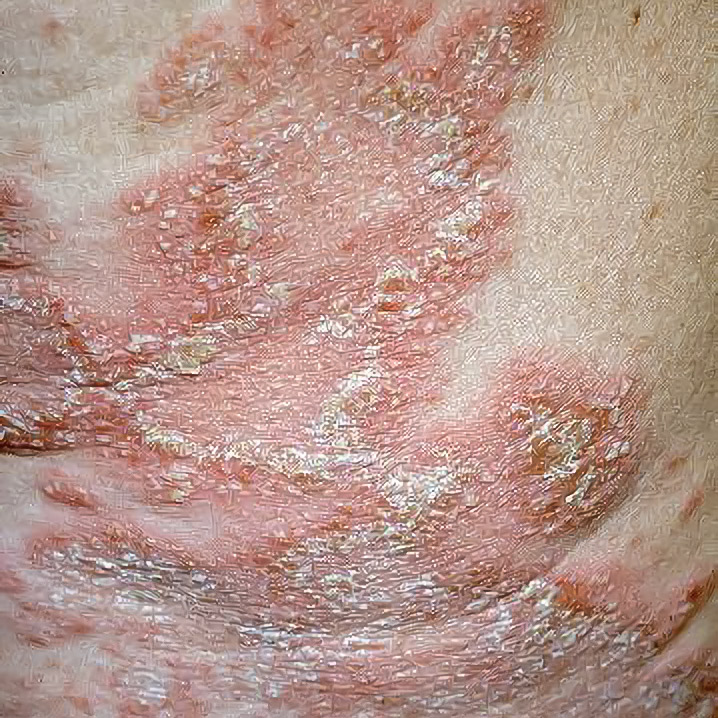
A classification neural network identifies the most probable conditions from a dermatological image. This is what Visiba Care currently integrates: the probability distribution across conditions that feeds into Red Robin's Bayesian network. Diagnosis answers the question: What might this condition be?
- Generalised pustular psoriasis77.03%
- Pustular psoriasis2.31%
- Pemphigus0.95%
- Zoster0.48%
- Cutaneous tuberculosis0.48%
- Generalised pustular psoriasis
- Pustular psoriasis
- Pemphigus
- Zoster
- Cutaneous tuberculosis
- Other
Clinical Indicators
What should I do about it?
Derived metrics that trigger workflows and provide actionable guidance for clinicians. Unlike diagnosis, which identifies what something is, indicators answer: What should I do about it? Examples include malignancy suspicion (flagging potentially cancerous lesions), urgent referral (cases requiring attention within 48 hours), and high priority referral (cases needing specialist review within 7-15 days). These are not diagnoses—they are call-to-action signals designed to support clinical decision-making regardless of the specific condition.
Suspicion of malignancy
62%
Predicted by the algorithm
- High-priority referral (15 days)Low (5.82%)That is, there is a low probability that the patient will need care in the next 15 days.
- Urgent referral (48 hours)High (35.07%)That is, there is a high probability that the patient will need care in the next 48 hours.Create Dermatology Referral ➤
Severity Measurement
How much of it is there?
Quantifies the degree of disease involvement rather than identifying the condition itself. A diagnosis tells you a patient has psoriasis; severity measurement tells you they have moderate-to-severe psoriasis with a PASI score of 12.5. This is achieved by measuring the intensity of individual clinical signs—erythema, induration, desquamation—and computing standardized scores using clinically validated instruments like PASI, SCORAD, IHS4, or EASI. Severity measurement answers: How bad is it?
Severity Score
Automatic Psoriasis Area and Severity Index
Mild
Severity
(PASI)
Time
Identified Opportunities
The following API capabilities are currently not utilized but offer substantial value. They span all three capability types described above:
| Feature | Current Status | Potential Impact |
|---|---|---|
| Malignancy suspicion score | Not used | High: Replace manual benign/malignant mapping |
| Entropy (confidence indicator) | Not used | High: Enable safer triage decisions |
| Urgent referral indicator | Not used | High: Automate 48-hour urgency flagging |
| High priority referral indicator | Not used | High: Automate 7-15 day referral needs |
| Severity scoring (PASI, SCORAD, etc.) | Not used | High: Enable clinical treatment decisions |
| Image quality score | Not used | Medium: Improve AI performance feedback |
| Visual signs (erythema, desquamation, etc.) | Not used | Medium: Complement chat-based questions |
Key Challenges Identified
- Difficulty evidencing impact: The optional nature of photos makes it challenging to quantify AI value
- Manual mapping workload: Maintaining condition mappings requires ongoing engineering effort
- Limited HCP visibility: Healthcare professionals see minimal AI output, reducing perceived value
- Customer value narrative: Sales teams need clearer materials to communicate the AI benefit
Strategic Recommendations
Phase 1: Quick Wins (Weeks 1-4)
Objective
Implement changes that deliver immediate value with minimal development effort.
Malignancy Suspicion Indicator
Challenge
Currently, Visiba Care manually maps each condition to benign or malignant categories.
Solution
Replace manual mapping with the malignancy indicator from the API.
{
  "clinicalIndicator": {
    "malignancy": 0.15 // Value between 0 and 1
  }
}
Recommended Thresholds
| Score Range | Risk Level | UI Display | Suggested Action |
|---|---|---|---|
| 0-15% | Low | Green | Standard triage flow |
| 16-30% | Moderate | Orange | Flag for clinical review |
| 31-100% | High | Red | Prioritize specialist referral |
Business Value
- Eliminates manual mapping maintenance for benign/malignant classification
- Provides consistent, validated risk assessment
- Stronger regulatory compliance story: "AI uses a validated malignancy suspicion model"
Example UI
Suspicion of malignancy
62%
Predicted by the algorithm
Entropy (Confidence Indicator)
Challenge
Triage decisions currently don't account for AI prediction confidence.
Solution
Implement the entropy indicator to flag low-confidence cases.
{
  "performanceIndicator": {
    "entropy": 0.25 // Normalized 0-1, lower = more confident
  }
}
Recommended Thresholds
| Entropy (0-100) | Certainty Level | UI Display | Suggested Action |
|---|---|---|---|
| 0-20 | Very High | Green | High confidence in AI output |
| 21-40 | High | Green | Reliable for triage |
| 41-60 | Moderate | Yellow | Consider with caution |
| 61-80 | Low | Orange | Flag for manual review |
| 81-100 | Very Low | Red | Treat as inconclusive |
Business Value
- Enables nuanced, safer triage decisions
- Strong regulatory narrative: "System behavior adapts based on model confidence"
- Reduces risk of over-reliance on uncertain predictions
Example UI
The normalized entropy value is high (69%), meaning the algorithm has low certainty about its analysis. Please keep this in mind when interpreting the results.
Improved Imaging Instructions
Challenge
Current instructions are generic; image quality varies significantly.
Solution
Implement differentiated instructions based on lesion type.
For Localized Lesions (moles, pigmentation)
| Step | Instruction | Rationale |
|---|---|---|
| 1 | Capture the photo with your mobile phone | Standard capture |
| 2 | Center the photo on the lesion | Ensures lesion is focal point |
| 3 | Take up to three images of the same lesion | Multiple angles improve accuracy |
| 4 | Crop the image | Removes background noise |
For Other Conditions (rashes, infections, inflammatory)
| Step | Instruction | Rationale |
|---|---|---|
| 1 | Capture the whole affected area | Broader context needed |
| 2 | Only send one dermatological problem at a time | Prevents confusion in analysis |
| 3 | Avoid covering the area with clothing/hair | Ensures visibility |
Implementation Note
Since Red Robin already asks whether symptoms are localized or widespread, this information can trigger the appropriate instruction set.
Business Value
- Improved image quality leads to better AI performance
- Clear user guidance improves experience
- Active guidance shows commitment to quality outcomes
Example UI: Problem Type Selection
Type of issue
Select the type of issue

Localized Lesion
For example, a mole or a pigmentation.

Something else
Any problem that is not on a fixed spot.

Step 1: Capture the photo with your mobile phone

Step 2: Center the photo on the lesion

Step 3: Take up to three images of the same lesion

Step 4: Crop the image to remove background noise
Phase 2: Enhanced Triage (Weeks 5-8)
Objective
Leverage additional API indicators to strengthen triage accuracy.
Referral Urgency Indicators
Solution
Integrate urgentReferral and highPriorityReferral indicators.
{
  "clinicalIndicator": {
    "urgentReferral": 0.05, // 0-48 hours
    "highPriorityReferral": 0.22 // 7-15 days
  }
}
Recommended Thresholds
| Indicator | Score Range | Action | UI Element |
|---|---|---|---|
| Urgent Referral | 31-100% | Immediate escalation | Red alert, "Urgent: 48-hour action required" |
| Urgent Referral | 16-30% | Clinical review needed | Orange warning |
| Urgent Referral | 0-15% | Standard flow | No special flag |
| High Priority Referral | 31-100% | Schedule within 7-15 days | Orange priority flag |
| High Priority Referral | 16-30% | Consider priority scheduling | Yellow note |
| High Priority Referral | 0-15% | Routine scheduling | No special flag |
Integration Approach
These indicators can either:
- Replace internal urgency calculations (simpler approach)
- Complement existing Bayesian network output (recommended for validation period)
Business Value
- Reduces risk of missing urgent cases
- Provides evidence-based urgency assessment
- Enables automated routing to appropriate care pathways
Example UI
- High-priority referral (15 days)Low (5.82%)That is, there is a low probability that the patient will need care in the next 15 days.
- Urgent referral (48 hours)High (35.07%)That is, there is a high probability that the patient will need care in the next 48 hours.Create Dermatology Referral ➤
Top-5 Predictions Display for HCPs
Challenge
HCPs currently see limited AI output, reducing perceived value.
Solution
Display the top diagnostic predictions to healthcare professionals.
{
  "conclusions": [
    {
      "code": { "coding": [{ "code": "EA90", "display": "Psoriasis" }] },
      "probability": 0.72
    },
    {
      "code": { "coding": [{ "code": "EA80", "display": "Atopic dermatitis" }] },
      "probability": 0.15
    }
    // ... top 5
  ]
}
Display Options
| Option | Description | Best For |
|---|---|---|
| Probability bars | Horizontal bars showing relative likelihood | Quick visual assessment |
| Percentage list | Text list with percentages | Detailed review |
| Confidence threshold | Only show predictions above X% | Reduced noise |
Recommended Approach
- Show top 5 predictions with probability bars
- Apply a minimum threshold (e.g., 5%) to avoid cluttering with unlikely conditions
- Include the entropy/confidence indicator alongside
Business Value
- HCPs see concrete AI value in daily practice
- Enables structured feedback collection
- Differentiates Red Robin from competitors
Image Quality Validation
Solution
Display image quality score to guide users toward better captures.
{
  "imagingAnalysis": {
    "mediaValidity": {
      "quality": {
        "score": 75 // 0-100
      }
    }
  }
}
Recommended Thresholds
| Score | Quality | UI Feedback | Action |
|---|---|---|---|
| 81-100 | Excellent | Green checkmark | Proceed with confidence |
| 61-80 | Good | Green checkmark | Proceed |
| 41-60 | Fair | Yellow warning | Consider retaking |
| 21-40 | Poor | Orange warning | Recommend retaking |
| 1-20 | Bad | Red warning | Request new image |
Business Value
- Improves overall image quality in the system
- Sets clear expectations with users
- Provides basis for performance analytics
Example UI
Report information
Information about the report.
- TimestampFeb 01, 2024, 10:06 PM
- Analysis performed in0.65 seconds
- Image modalityDermatoscopic
- Visual image quality82%
Phase 3: Severity and Monitoring (Weeks 9-12)
Objective
Introduce severity scoring capabilities that transform the integration from diagnostic support into clinical treatment decision support.
Severity Scoring Integration
Context
While diagnosis tells clinicians what condition a patient has, severity scoring tells them how bad it is—and this distinction drives treatment decisions. A patient with mild psoriasis may need only topical therapy, while severe psoriasis requires systemic treatment or biologics. Without severity data, clinicians must assess this manually, which is time-consuming and subjective.
Severity scoring systems like PASI (Psoriasis Area and Severity Index) and SCORAD (Scoring Atopic Dermatitis) are standardized, clinically validated instruments used worldwide to quantify disease severity. They are the foundation of treatment guidelines, clinical trial endpoints, and reimbursement criteria. By integrating these scores, Red Robin can provide actionable clinical intelligence that directly informs the treatment pathway—not just the referral decision.
Supported Scoring Systems
| Condition | Scoring System | API Code | Output Range |
|---|---|---|---|
| Psoriasis | PASI | apasi | 0-72 |
| Atopic Dermatitis | SCORAD, EASI | scorad | 0-103 |
| Alopecia | SALT | salt | 0-100 |
| Hidradenitis Suppurativa | IHS4, HiSCR | ihs4 | Variable |
And many more. See the /questionnaires?pathology={ICD-11} endpoint for full details.
API Response Structure
{
  "patientEvolution": {
    "apasi": {
      "score": {
        "value": 12.5,
        "interpretation": {
          "category": "Moderate",
          "intensity": 2 // 0=None, 1=Mild, 2=Moderate, 3=Severe
        }
      }
    }
  }
}
Implementation Approach
- When top-1 diagnosis probability exceeds threshold (e.g., 40%), check if severity scoring is available for that condition
- Use the
/questionnaires?pathology={ICD-11}endpoint to determine if additional questions are needed - Display severity result to HCP with interpretation
Business Value
- Treatment pathway guidance: Severity scores directly map to treatment guidelines, enabling appropriate therapy recommendations
- Monitoring over time: Track whether a patient is improving, stable, or worsening across visits—essential for chronic disease management
- Clinical trial alignment: Pharmaceutical customers require standardized severity measures; this positions Red Robin as a clinical trial-ready platform
- Reimbursement support: Many payers require documented severity scores to approve biologic or systemic treatments
Example UI
Severity Score
Automatic Psoriasis Area and Severity Index
Mild
Visual Signs Display
Solution
Surface individual clinical sign assessments to complement chat-based questions.
{
  "item": {
    "erythema": { "value": 2, "text": "Erythema" },
    "desquamation": { "value": 3, "text": "Desquamation" },
    "induration": { "value": 1, "text": "Induration" }
  }
}
Display Format
| Clinical Sign | Value (0-4) | Interpretation |
|---|---|---|
| Erythema | 2 | Moderate redness |
| Desquamation | 3 | Significant scaling |
| Induration | 1 | Mild thickening |
Integration Opportunity
Cross-reference AI-detected visual signs with patient-reported symptoms from the chat to validate consistency.
Example UI
Desquamation
Moderate (2)
Erythema
Moderate (2)
Induration
Mild (1)
Affected area
30% (2)
Evolution Tracking
Solution
For patients with multiple visits, track severity changes over time.
Business Value
- Demonstrates treatment effectiveness
- Supports clinical decision-making for treatment adjustments
- Valuable for pharmaceutical and clinical trial customers
Example UI
Severity
(PASI)
Time
Phase 4: Value Communication (Weeks 13-16)
Objective
Strengthen the commercial value proposition and customer engagement.
HCP Dashboard Enhancements
Proposed Elements
| Element | Description | Value |
|---|---|---|
| AI Confidence Badge | Visual indicator of prediction certainty | Builds appropriate trust |
| Top Diagnoses Panel | Collapsible section showing top 5 predictions | Quick reference |
| Severity Gauge | Visual representation of condition severity | Clinical decision support |
| Image Quality Indicator | Shows quality score for submitted images | Quality feedback loop |
Sales Enablement Materials
-
Value Slides (2-3 slides): For Visiba Care's sales decks
- What AI provides in the Red Robin context
- How AI complements rules-based triage
- Example scenarios from primary care
-
Customer-Facing Brief (1 page):
- How AI reduces uncertainty in primary care skin assessments
- How it identifies high-risk cases
- How it improves the patient journey
-
FAQ Document:
- Non-technical answers for customer meetings
- Handling objections about AI reliability
- Evidence and validation references
Implementation Timeline
Phase Summary
| Phase | Duration | Key Deliverables | Business Outcome |
|---|---|---|---|
| Quick Wins | Weeks 1-4 | Malignancy indicator, entropy display, improved instructions | Reduced maintenance, safer triage |
| Enhanced Triage | Weeks 5-8 | Referral indicators, top-5 display, image quality | Better accuracy, HCP visibility |
| Severity | Weeks 9-12 | Severity scoring, visual signs, evolution tracking | Chronic condition support |
| Communication | Weeks 13-16 | Dashboard, sales materials, impact evaluation | Stronger value proposition |
Technical Reference
API Keys Quick Reference
| Feature | Endpoint | Response Path | Type |
|---|---|---|---|
| Diagnosis probabilities | /diagnosis-support | conclusions[].probability | Float 0-1 |
| ICD-11 codes | /diagnosis-support | conclusions[].code.coding[].code | String |
| Malignancy | /diagnosis-support | clinicalIndicator.malignancy | Float 0-1 |
| Urgent referral | /diagnosis-support | clinicalIndicator.urgentReferral | Float 0-1 |
| High priority referral | /diagnosis-support | clinicalIndicator.highPriorityReferral | Float 0-1 |
| Entropy | /diagnosis-support | performanceIndicator.entropy | Float 0-1 |
| Image quality | /diagnosis-support | imagingAnalysis.mediaValidity.quality.score | Integer 0-100 |
| Severity score | /severity | patientEvolution.[system].score.value | Varies |
| Severity interpretation | /severity | patientEvolution.[system].score.interpretation | Object |
| Clinical signs | /severity | item.[signName].value | Integer 0-4 |
Helper Endpoints
| Endpoint | Purpose | Use Case |
|---|---|---|
/body-sites | Standardized body location codes | Consistent anatomical reference |
/clinical-signs | Visual sign translations | Multilingual support |
/questionnaires?pathology={ICD-11} | Scoring system availability | Determine if questionnaire needed |
Expected Benefits
For Visiba Care Engineering
| Benefit | Impact | Phase |
|---|---|---|
| Reduced mapping maintenance | Eliminate manual benign/malignant classification | 1 |
| Simplified urgency logic | Leverage pre-calculated referral indicators | 2 |
| ICD-11 code alignment | Reduce mapping updates when device version changes | 1-2 |
For Visiba Care Commercial
| Benefit | Impact | Phase |
|---|---|---|
| Stronger value narrative | "AI provides malignancy assessment, confidence scores, and severity monitoring" | All |
| Differentiation | Features competitors may not offer | 2-3 |
| Customer retention | Enhanced capabilities keep customers engaged | 3-4 |
For End Customers (Healthcare Providers)
| Benefit | Impact | Phase |
|---|---|---|
| Safer triage | Confidence and urgency indicators flag edge cases | 1-2 |
| Better informed decisions | Top-5 predictions visible to HCPs | 2 |
| Chronic condition support | Severity scoring and evolution tracking | 3 |
Commercial Considerations
Pricing Model Alignment
The current per-capita pricing model aligns well with Visiba Care's customer pricing structure. Enhanced features can be positioned as:
- Standard tier: Current integration + Phase 1 features (malignancy, entropy)
- Professional tier: + Phase 2 features (referral indicators, HCP dashboard)
- Enterprise tier: + Phase 3 features (severity scoring, evolution tracking)
ROI Framework
| Category | Metric | Estimated Impact |
|---|---|---|
| Engineering efficiency | Hours saved on mapping maintenance | 40-60 hrs/year |
| Development velocity | New feature integration time | 30-50% faster |
| Customer retention | Reduced churn from enhanced value | To be measured |
| New customer acquisition | Competitive differentiation | Qualitative |
Joint Value Demonstration
We propose a joint case study or validation study that:
- Documents improvement in triage accuracy
- Quantifies time savings for HCPs
- Provides evidence for customer sales conversations
Next Steps
Immediate Actions (Week 0)
| Action | Owner | Target Date |
|---|---|---|
| Prioritization meeting | Visiba Care + Legit.Health | TBD |
| Technical deep-dive on Phase 1 | Engineering teams | TBD |
| Access to additional API documentation | Legit.Health | TBD |
Phase 1 Kick-off
| Action | Owner | Target Date |
|---|---|---|
| Malignancy indicator implementation | Visiba Care Engineering | Week 2 |
| Entropy display design review | Visiba Care UX + Legit.Health | Week 1 |
| Imaging instructions content finalization | Joint | Week 3 |
Ongoing Support
Legit.Health commits to providing:
- Technical support during implementation
- Access to updated API documentation
- Sales enablement material drafts
- Impact evaluation consultation
Signature meaning
The signatures for the approval process of this document can be found in the verified commits at the repository for the QMS. As a reference, the team members who are expected to participate in this document and their roles in the approval process, as defined in Annex I Responsibility Matrix of the GP-001, are:
- Author: Team members involved
- Reviewer: JD-003 Design & Development Manager, JD-004 Quality Manager & PRRC
- Approver: JD-001 General Manager
ㅤㅤ ㅤ