TEST_001 The user receives quantifiable data on the intensity of clinical signs
Test type
System
Linked activities
- MDS-100
- MDS-99
- MDS-173
- MDS-408
Result
- Passed
- Failed
Description
Tests carried out with the automatic visual sign intensity quantification algorithms, to verify that the performance is comparable to that of an expert dermatologist.
Objective
The goal is to prove that the quantifiable data on the intensity of clinical signs received by the user is extracted with expert dermatologist-level performance.
Acceptance criteria
Relative Mean Absolute Error (RMAE) must be smaller than 20%.
Materials & methods
Ground truth generation
We employed a total of 5,459 images, each depicting dermatosis and displaying the visual signs specified in the requirement. These image sets underwent evaluation by distinct dermatology experts, enabling us to conduct a variability analysis. Each expert annotated the data by assigning a label (either ordinal or categorical) to every image. Subsequently, the algorithm learned from the consensus among these experts, which served as the gold standard for training.
In order to assess if the dataset size is adequate, we begin by calculating RMAE values, which measure the variability or error in the data. The RMAE metric provides insight into the variability of annotations across annotators for each instance in the dataset. A higher RMAE indicates greater variability in annotations for a particular instance, suggesting ambiguity or complexity in the task. Conversely, a lower RMAE suggests more consistent annotations, indicating clarity in the task or data. We plot these RMSE values against the dataset size. As the dataset size increases, the standard deviation of these values fluctuates, initially high but gradually decreasing. By observing the standard deviation within a window of three tests, and once it falls below a threshold of 0.02, it indicates that the dataset's variability has stabilised, suggesting that further additions to the dataset are unlikely to significantly impact performance. This approach is asserted to be consistent across different datasets, providing a reliable means of identifying an appropriate dataset size for the task at hand.
To establish the ground truth, we employed mean and median statistics, which are widely recognized and established in the literature as the most suitable methods for constructing ground truth when working with ordinal categorical data. After generating the ground truth labels, the dataset was split to obtain a training, a validation, and a test set for each task. As there was no patient-related metadata available, the data was split randomly using K-fold cross-validation. The reported result metrics are computed on the validation sets.
To determine whether the dataset is sufficiently large to meet our objectives, we first evaluate the complexity of the tasks at hand. This evaluation involves a thorough analysis of medical evidence, supplemented by a variability study conducted in collaboration with experienced doctors. These doctors possess an in-depth understanding of the nuances of each problem, enabling us to establish a robust baseline for our analysis.
In this scenario, we have computed crucial metrics for the annotated dataset, specifically focusing on the Relative Mean Absolute Error (RMAE) and the Relative Standard Deviation (RSD). The results from the doctors yielded values approximately at 13.8% for RMAE and 12.56% for RSD. While these figures reflect a moderate level of agreement among the experts, such a degree of concordance is anticipated for a problem with this complexity. These metrics not only imply that the dataset's size is adequate, but they also establish a foundational benchmark for our computer vision algorithms.
Model training and evaluation
Regarding the model, we trained several multioutput classifiers, one for each task. Each classifier consists of a single deep-learning backbone and several classification heads, one per visual sign. We used the EfficientNet-B0 network architecture that was pre-trained on approximately 1.28 million images (1,000 object categories) from the 2014 ImageNet Large Scale Visual Recognition Challenge and trained it on our dataset using transfer learning. EfficientNets achieve better accuracy and efficiency than previous convolutional neural networks with fewer parameters by applying a new scaling method that uniformly scales all dimensions of depth/ width/resolution using a simple yet highly effective compound coefficient. There are eight versions, consisting of a different number of parameters, with the B0 being the smallest network that achieves state-of-the-art 77.1% top-1 accuracy on ImageNet for a network consisting of 5 million parameters. Regarding the transfer learning strategy, all the models undergo the same training: first, we freeze all layers (except for the last linear layer) and train the model for several epochs; then we unfreeze all layers and fine-tune the entire model for another number of epochs.
In summary, we implemented one model for each of the following tasks, each task including one or more visual signs:
- Estimation of intensity of erythema, edema, oozing, excoriation, lichenification, and dryness
- Estimation of intensity of erythema, induration and desquamation
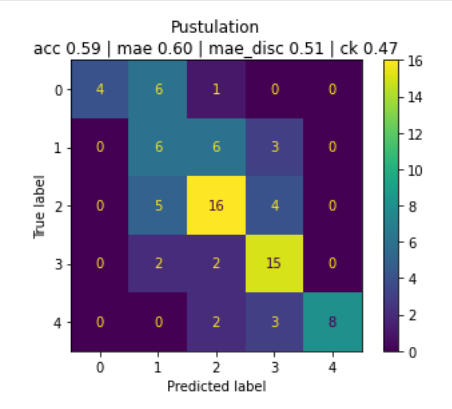
- Estimation of erythema, pustulation, and desquamation
- Estimation of erythema, exudation, edges, affected tissues
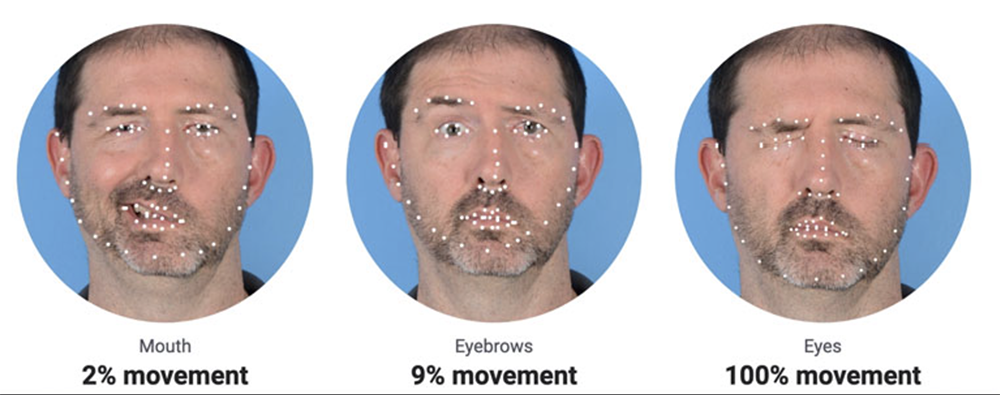
- Estimation of facial palsy
The processors we assessed in this test are APULSI, APASI, NSIL and ASCORAD.
Results
The algorithms' performance is remarkable. It maintains an average Relative Mean Absolute Error (RMAE) of just 13% for assessing erythema, edema, oozing, excoriation, lichenification, and dryness. Furthermore, all individual RMAE values remain below the 20% threshold. In the cases of induration, desquamation, and pustulation, RMAE values are also comfortably below 20%, meeting the predetermined criteria. For the evaluation of edges, exudation and affected tissues, the outcome demonstrates a balanced accuracy of 64%, 74% and 69%, signifying strong performance. When measuring facial palsy, the algorithm excels with an RMAE of only 9%, further emphasizing its exceptional performance.
Protocol deviations
There were no deviations from initial protocol.
Conclusions
The quantifiable data regarding the intensity quantification of clinical signs provided to the user matches the expertise of dermatologists. This ensures the quality of the data, offering healthcare practitioners the best information to support their clinical assessments.
Test checklist
The following checklist verifies the completion of the goals and metrics specified in the requirement REQ_001.
Requirement verification
- The algorithm's Relative Mean Absolute Error (RMAE) for quantifying erythema intensity is less than 20%.
- The algorithm's Relative Mean Absolute Error (RMAE) for quantifying induration intensity is less than 20%.
- The algorithm's Relative Mean Absolute Error (RMAE) for quantifying desquamation intensity is less than 20%.
- The algorithm's Relative Mean Absolute Error (RMAE) for quantifying edema intensity is less than 20%.
- The algorithm's Relative Mean Absolute Error (RMAE) for quantifying oozing intensity is less than 20%.
- The algorithm's Relative Mean Absolute Error (RMAE) for quantifying excoriation intensity is less than 20%.
- The algorithm's Relative Mean Absolute Error (RMAE) for quantifying lichenification intensity is less than 20%.
- The algorithm's Relative Mean Absolute Error (RMAE) for quantifying dryness intensity is less than 20%.
- The algorithm's Relative Mean Absolute Error (RMAE) for quantifying pustulation intensity is less than 20%.
- Balanced Accuracy for quantifying exudation intensity is greater than 60%.
- Balanced Accuracy for quantifying edges intensity is greater than 60%.
- Balanced Accuracy for quantifying affected tissues intensity is greater than 60%.
- The algorithm's Relative Mean Absolute Error (RMAE) for quantifying facial palsy intensity is less than 20%.
Evidence
Evidence for erythema, edema, oozing, excoriation, lichenification and dryness can be found in the following article:
Automatic SCOring of Atopic Dermatitis Using Deep Learning: A Pilot Study
Alfonso Medela, Taig Mac Carthy, S. Andy Aguilar Robles, Carlos M. Chiesa-Estomba, Ramon Grimalt
Published: February 10, 2022
DOI: https://doi.org/10.1016/j.xjidi.2022.100107
Evidence for induration, desquamation and pustulation can be found in the following drafts containing the whole procedure:
APASI: Automatic Psoriasis Area Severity Index Estimation using Deep Learning
Alfonso Medela1, *, Taig Mac Carthy1,** ,+, Andy Aguilar1,***, Pedro G ́omez-Tejerina1,****, Carlos M Chiesa-Estomba2,3,4, Fernando Alfageme-Rold ́an5,+, and Gaston Roustan Gull ́on5,+
1 Department of Medical Computer Vision and PROMs, LEGIT.HEALTH, 48013, Bilbao, Spain
2 Department of Otorhinolaryngology, Osakidetza, Donostia University Hospital, 20014 San Sebastian, Spain
3 Biodonostia Health Research Institute, 20014 San Sebastian, Spain
4 Head Neck Study Group of Young-Otolaryngologists of the International Federations of Oto-rhino-laryngological Societies (YO-IFOS), 13005 Marseille, France
5 Servicio de Dermatología, Hospital Puerta de Hierro, Majadahonda, Madrid, Spain
Not published at the time of writing this
In the following confusion matrix we see the performance on pustules:
Evidence of an outcome for exudation intensity, edges intensity, affected tissue intensity:
| **Evaluator ** | Visual sign intensity |
|---|---|
| Model | Edges: Delimited Exudation: Fibrinous Exudate type: Serous Affected tissues: Affection of bone and/or adnexal tissues. |
| Annotator | Edges: Delimited Exudation: Fibrinous Exudate type: Serous Affected tissues: Affection of bone and/or adnexal tissues. |
The sample image is the following:
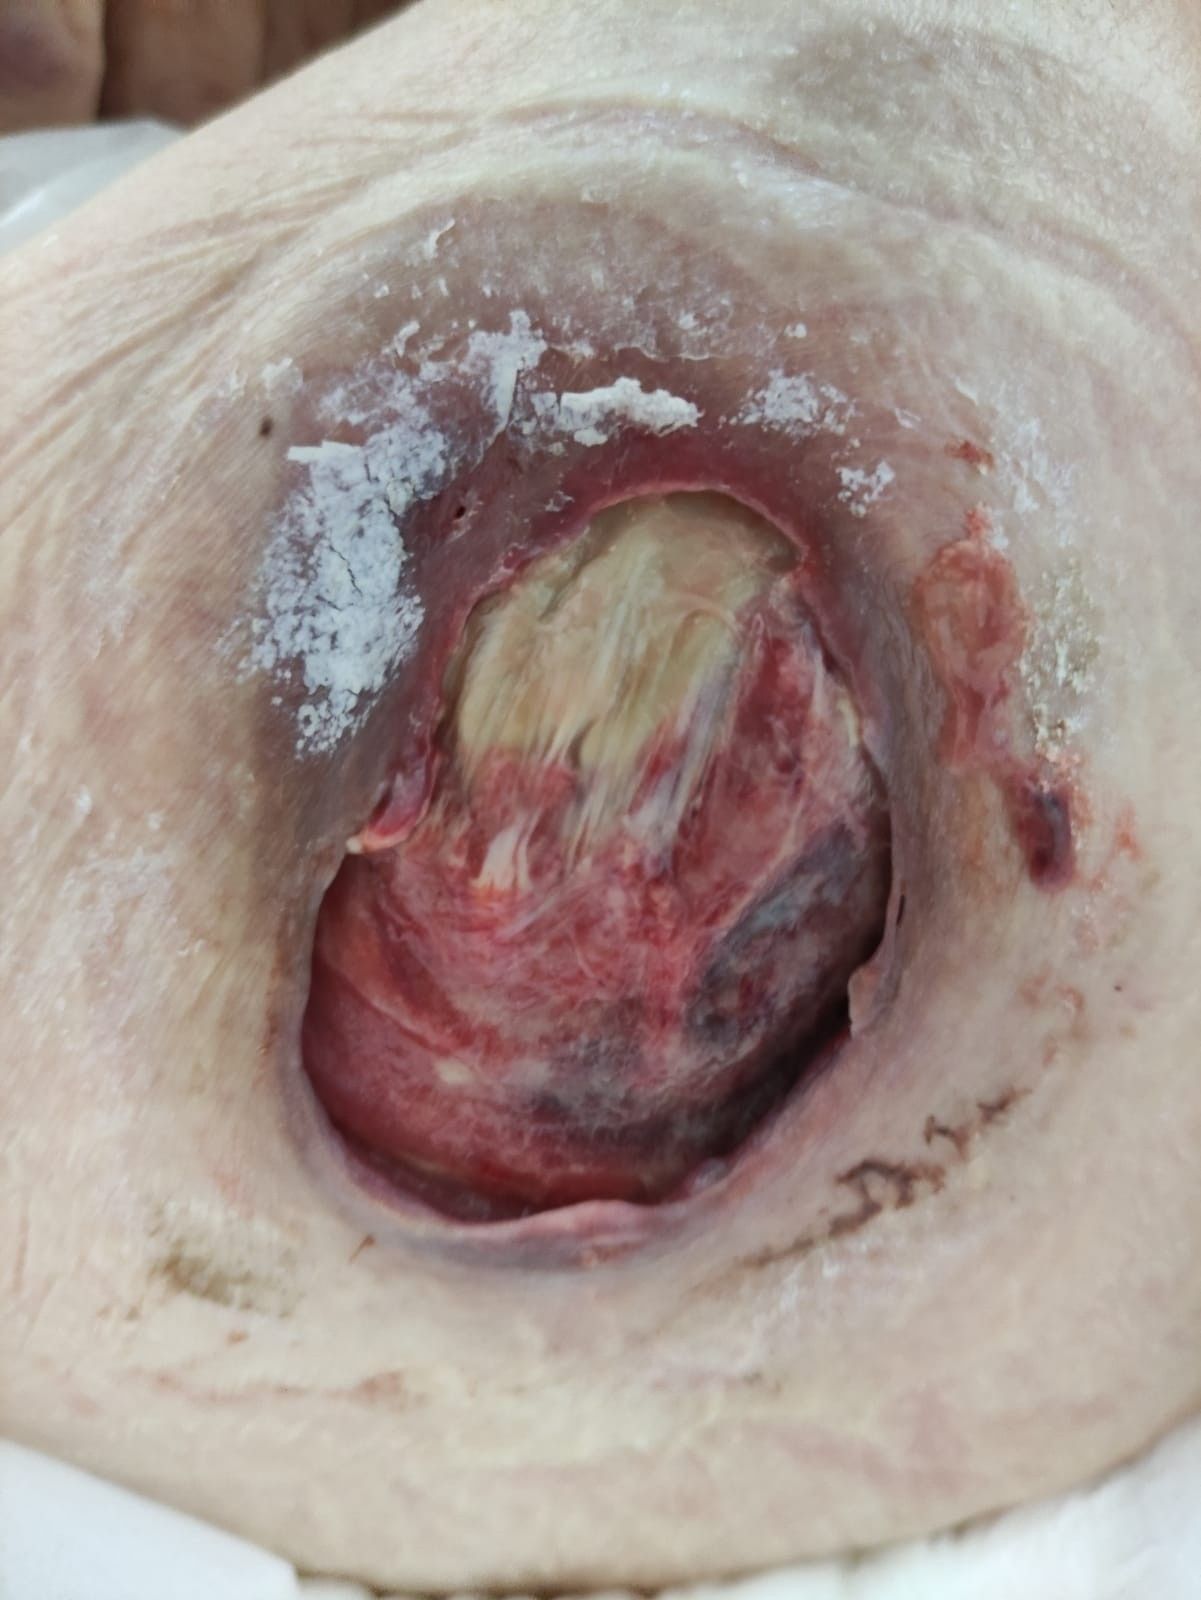 | Edges: Delimited
Exudation: Fibrinous
Exudate type: Serous
Affected tissues: Affection of bone and/or adnexal tissues. |
Evidence of facial palsy intensity quantification:
Signature meaning
The signatures for the approval process of this document can be found in the verified commits at the repository for the QMS. As a reference, the team members who are expected to participate in this document and their roles in the approval process, as defined in Annex I Responsibility Matrix of the GP-001, are:
- Tester: JD-017, JD-009, JD-004
- Approver: JD-005